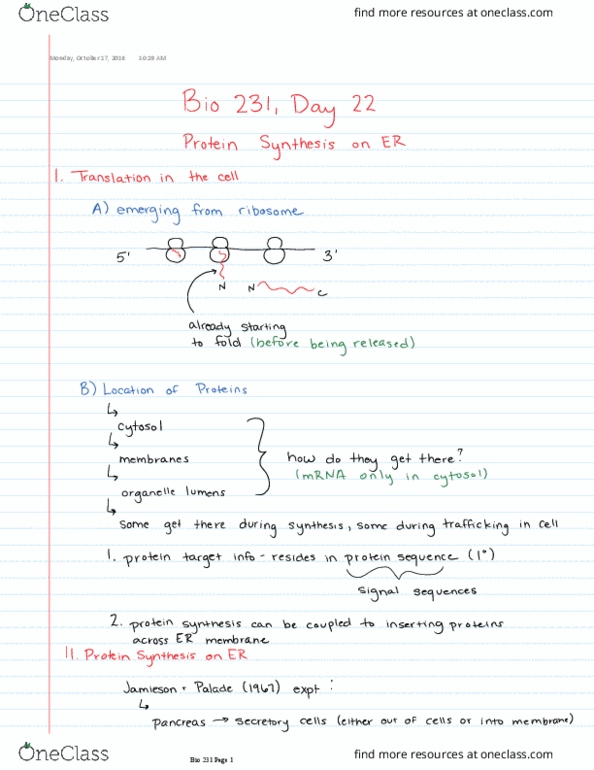
BIOL 23100 Lecture 9: Protein Structure and Function: Protein-Ligand Binding

Get access


Related Documents
Related Questions
please TYPE and fill the calories, carbohydrate, protein, and fat parts ( approximately) of the table;
There is no need to be 100% precise just do your best, and estimate, if you don't have exact numbers & answer the below question:
| Time | Qty | Food/Beverage Description | Calories | Hunger 1-10 | Mood 1-10 | Carbohydrate gram | Protein gram | Fat gram | ||||
| 5:30 | 1glass | water | 6 | 5 | ||||||||
| 7:30 AM | 1 glass | Smoothi/Milk,banana | 8 | 9 | ||||||||
| 8:30AM | 1 glass | water | 3.0 | 6 | ||||||||
| 9:30 AM | 2 | dates | 6.0 | 8.0 | ||||||||
| 11:00 AM | 1 glass | water | 4 | 6.0 | ||||||||
| 12:30 PM | 2 | Two pieces pizza | 1 | 9.0 | ||||||||
| 1:30 PM | 1 cup | hot black tea | 4 | 6.0 | ||||||||
| 4:30 PM | 1 small | Bowl vegetables | 2 | 9.0 | ||||||||
| 7:15 PM | 1 glass | water | 6.0 | 8.0 | ||||||||
| 8:30 PM | 1 plate | Half rice/ half steam chicken | 9.5 | 10.0 | ||||||||
| 9:15 | I glass | water | 3 | 7 | ||||||||
| 9:42 | I cup | Hot green tea | 4 | 8 |
only one hour walking as anexcercise
| Question: Are you meeting you Acceptable Macro Nutrtient Ranges on Day . If not which macronutrient is out of range and why? | |||||
| Yes/No Marcronutrient Ranges Met | Which Macronutreint was out of range? | Why do you think the Macronutrient was out of range? | |||
| DAY 1 | |||||
HELP ON ECOLOGY LAB REPORT PLEASE!!!
- The AIM of this lab exercise: Does Eastern Mosquitofish (Gambusia holbrooki) population structure differ with season?
- You will compare population structure in an FIU pond from February 2018 (previous semester) with the data that you collect this semester (September 2018).
- CREATE HYPOTHESIS ABOUT POPULATION STRUCTURE (HELP PLEASE)
(HELP PLEASE) Include at least one paragraph ON THE key points of comparison between the life tables. Include the major results for population structure, even if no difference is found! Do these populations differ with respect to optimal age of sexual maturity, R0, G, and r?
FEBRUARY 2018 CURRENT RESULTS
| Age Class (days) x | Sample/ Age s(x) | Number/ Age n(x) | Survival Rate 1(x) | Fecundity b(x) | Offspring/Ind 1(x)*b(x) | Age Weighted Fecundity 1(x)*b(x)*x |
| 0 | 24 | 120 | 1 | 0 | 0 | 0 |
| 30 | 39 | 96 | 0.8 | 0 | 0 | 0 |
| 60 | 19 | 57 | 0.475 | 0 | 0 | 0 |
| 90 | 21 | 38 | 0.317 | 24 | 7.608 | 684.72 |
| 120 | 8 | 17 | 0.142 | 27 | 3.834 | 460.08 |
| 150 | 5 | 9 | 0.075 | 29 | 2.175 | 326.25 |
| 180 | 2 | 4 | 0.033 | 32 | 1.056 | 190.08 |
| 210 | 0 | 2 | 0.017 | 0 | 0 | 0 |
| 240 | 1 | 2 | 0.017 | 0 | 0 | 0 |
| Sum | 120 | R0 | 14.673 Offspring | |||
| G | 113.209 Days | |||||
| r | 0.024 Ind/ Days | |||||
| Optimal Age for Sexual Maturity | 120 Days |
SEPTEMBER 2018 RESULTS:
| Life Table | ||||||
| Age class (days) | Sample/ age class | Number/ age class | Survival rate | Fecundity | Offspring/ individual | Age-weighted fecundity |
| x | n(x) | n(x) | l(x) | b(x) | l(x)*b(x) | l(x)*b(x)*x |
| 0 | 9 | 150 | 1 | 0 | 0 | 0 |
| 30 | 12 | 141 | 0.94 | 0 | 0 | 0 |
| 60 | 26 | 129 | 0.86 | 0 | 0 | 0 |
| 90 | 29 | 103 | 0.687 | 24 | 16.48 | 1483.2 |
| 120 | 33 | 74 | 0.493 | 27 | 13.32 | 1598.4 |
| 150 | 18 | 41 | 0.273 | 29 | 7.93 | 1189 |
| 180 | 16 | 23 | 0.153 | 32 | 4.91 | 883.2 |
| 210 | 7 | 7 | 0.047 | 0 | 0 | 0 |
| 240 | 0 | 0 | 0 | 0 | 0 | 0 |
| Sum | 150 | |||||
| R0 | 42.63 | offspring | ||||
| G | 120.89 | days | ||||
| r | 0.03 | individuals/ day | ||||
| Optimal age for sexual maturity | 120 | days | ||||
I am learning about seeding wells and I am honestly confused with the whole process, such as the calculations, what is a surface area of a 6 well or 24 well plate and how am I supposed to use the information below for this process? Can someone explain what this information means below and how I can use this information when seeding cells in lab? Thank you.
| 3T3 18hr doubling time | Final count on confluent plate | 2 days ahead # cells to seed | 3 days ahead # cells to seed | 4 days ahead # cells to seed |
| 3cm or 6 well | 1 x 10⁶ | 2.5 x 10⁵ | 1 x 10⁵ | 2.5 x 10⁴ |
| 6cm or T-25 | 2 x 10⁶ | 5 x 10⁵ | 2 x 10⁵ | 5 x 10⁴ |
| 10cm | 5 x 10⁶ | 1.25 x 10⁶ | 5 x 10⁵ | 1.25 x 10⁵ |
These are approximate
| E63 or CV1 19hr doubling time | Final count on confluent plate | 2 days ahead # cells to seed | 3 days ahead # cells to seed | 4 days ahead # cells to seed |
| 3cm or 6 well | 5 x 10⁵ | 1 x 10⁵ | 5 x 10⁴ | |
| 6cm or T-25 | 1 x 10⁶ | 2 x 10⁵ | 1 x 10⁵ | |
| 10cm | 2 x 10⁶ | 5 x 10⁵ | 2 x 10⁵ |
Seeding: 2 day = 48 hr, 3 day = 72 hr
3T3 cells are smaller than E63s so more is needed for seeding
If cell seeding density is known for 10cm dish, for a 6cm dish, divide by 3 and round up.
Useful formula to calculate total cells for final count
2Px = final count on plate
Where 2 represents doubling
x is the initial number of cells
P is the number of periods in time frame
So, in four days for a cell with an 18 hour doubling time, there are 5.3 doubling periods
| Tissue culture vessel | Surface growth area | Volume of media | Volume of trypsin |
| 35mm dish | 9.0cm2 | 2.0ml | 0.2-0.3ml |
| 60mm dish | 21.0cm2 | 4.0ml | 0.5-0.6ml |
| 100mm dish | 56.75cm2 | 10.0-ml | 1.0ml |
| T-25 flask | 25cm2 | 7.0-8.0ml | 0.5-0.8ml |
| T-75 flask | 75cm2 | 20-30ml | 1.0ml |
| T-175 flask | 175cm2 | 45-55ml | 2.0ml |
| 6 well multiwell plate | 9.6cm2 per well | 2.0ml per well | 0.2-0.3ml per well |
| 12 well multiwell plate | 3.8cm2 per well | 1.0ml per well | 0.1-0.2ml per well |
| 24 well multiwell plate | 2.0cm2 per well | 0.8-1.0ml per well | 0.08-0.10ml per well |
| 48 well multiwell plate | 0.75cm2 per well | 0.5-0.8ml per well | 0.05-0.08ml per well |
| 96 well multiwell plate | 0.32cm2 per well | 0.1-0.2ml per well | 0.01-0.02ml per well |