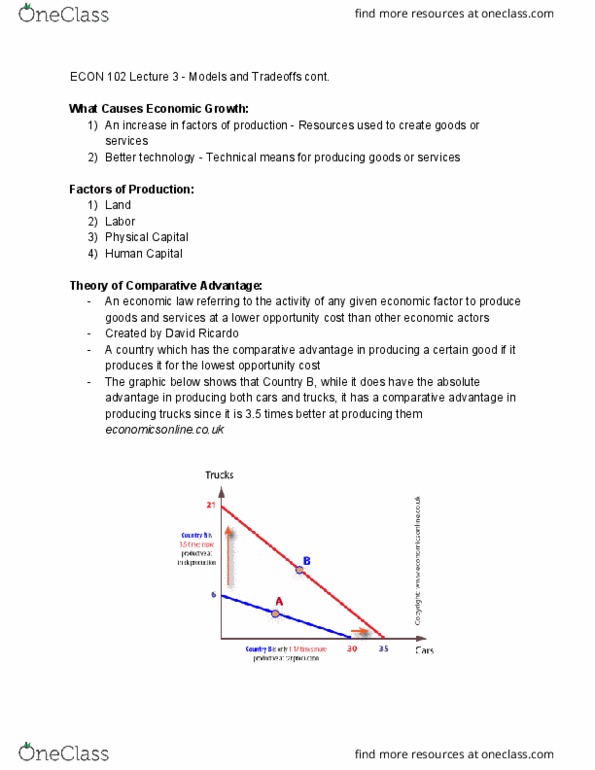
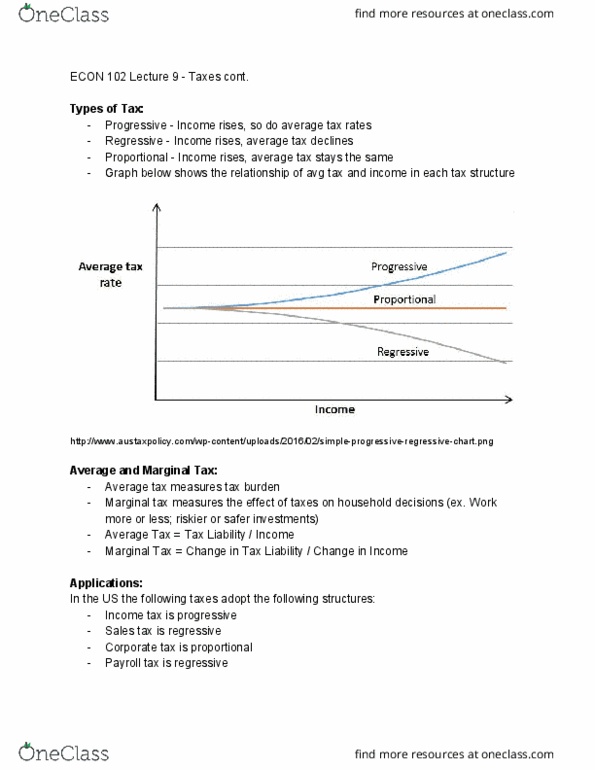
| D.take the market price as given. 1 Which of the following is NOT characteristic of a market economy? | Significant government intervention | | Little or no government intervention | | Buyers and sellers motivated by self-interest | | Prices determined by demand and supply | 2 In a competitive market, the price of the product is | independently set by each competing seller. | | set by the market leader and then copied by other sellers. | | jointly set after a meeting of all sellers in the market. | | set by market supply and demand. | 3 Which of the following firms participates in a competitive market? | A new car manufacturer, such as Ford, Honda, Toyota, or GMC | | A software producer, such as Microsoft | | A local electric utility company | 4 In an imperfect market, individual firms | are always able to set the price of their product. | | are able to influence the price of their product. | | have no influence over the price of their product. | | take the market price as given. | 5 Which of the following firms operates as a monopoly? | A fish vendor at a neighborhood market | 6 According to the law of demand, what is the relationship between price and quantity demanded? 7 Refer to the following graph. The demand curve slopes downward because
Click to view graphic. (Links to an external site.) | prices and quantity demanded move in opposite directions. | | prices and quantity demanded move in the same direction. | | prices and quantity demanded have no relationship. | | prices and quantity demanded remain unchanged. | 8 A change in which of the following will cause a change in the quantity demanded of coffee? | The price of green tea, a substitute for coffee | | The number of coffee consumers | 9 Suppose that burgers and fries are complements in consumption. If the price of fries increases | overall demand for burgers will increase. | | overall demand for burgers will decrease. | | quantity demanded for burgers will increase. | | quantity demanded for burgers will decrease. | 10 Suppose that Coca Cola and Pepsi are substitutes in consumption. If the price of Coca Cola decreases, then | both the equilibrium price and the quantity of Pepsi demanded will decrease. | | both the equilibrium price and the quantity of Pepsi demanded will increase. | | the equilibrium price of Pepsi will increase and the quantity demanded of Pepsi will decrease. | | the equilibrium price of Pepsi will decrease and the quantity demanded of Pepsi will increase. | 11 According to the law of supply, what is the relationship between price and quantity supplied? | It depends on the change in price | 12 Refer to the graph below. The supply curve is _______________ driven by the law of supply.
Click to view graphic. (Links to an external site.) 13 A change in which of the following will cause a change in the quantity supplied of coffee? | The technology or the production process of making coffee | | Anticipation of a change in the price of coffee | | The wages of coffee bean pickers | 14 Which of the following will cause a rightward shift in the supply curve for tobacco? | A fall in the number of tobacco farmers in the market | | An increase in taxes on tobacco | | Removal of government subsidies to tobacco farmers | | An improvement in the technology used in the production of tobacco | 15 Flour is a factor of production of cupcakes. How will an increase in the price of flour affect the market for cupcakes? | Overall supply will increase | | Overall supply will decrease | | Quantity supplied will increase | | Quantity supplied will decrease | 16 Refer to the following image. When a market is in equilibrium, which of the following is true?
Click to view graphic. (Links to an external site.) | Quantity supplied exceeds quantity demanded | | Quantity supplied is less than quantity demanded | | Quantity supplied is equal to quantity demanded | | There is no relationship between quantity supplied and quantity demanded | 17 Refer to the following figure. At a price of $15, this market is experiencing a(n)
Click to view graphic. (Links to an external site.) | none of the above are true. | 18 Refer to the following figure. At a price of $5, this market is experiencing
Click to view graphic. (Links to an external site.) | None of the above are true. | 19 Suppose pasta salad is a normal good. If the price of pasta (a major ingredient in pasta salad) increases and income also increases, the | equilibrium quantity and equilibrium price of pasta salad will increase. | | equilibrium quantity of pasta salad will decrease and the equilibrium price of pasta salad may either increase or decrease. | | equilibrium quantity of pasta salad may either increase or decrease and the equilibrium price of pasta salad will increase. | | equilibrium quantity and equilibrium price of pasta salad will both decrease. | 20. What must happen to the market price in order for a shortage to be eliminated? | Price must stay the same. | | Price may rise or fall depending on the size of the shortage. | | 


