CEE 5244 Lecture Notes - Lecture 51: Dimensionality Reduction, Sea Surface Temperature, Petal

5 Apr 2016
School
Department
Course
Professor
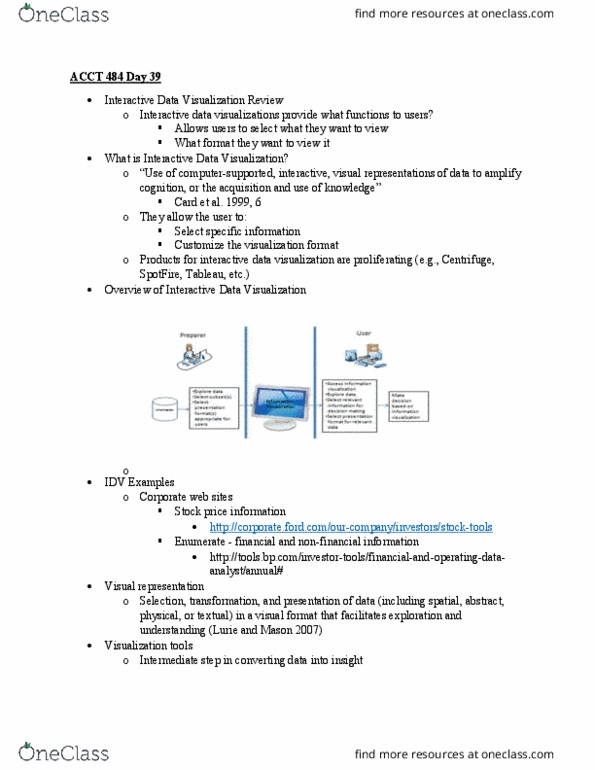
Document Summary
Lecture 51 (cid:1) this is also sensitive to outliers, so that other measures are often used. (cid:1) visualization. Humans have a well developed ability to analyze large amounts of information that is presented visually. Can detect outliers and unusual patterns (cid:1) example: sea surface temperature (cid:1) the following shows the sea surface temperature (sst) for july 1982. Tens of thousands of data points are summarized in a single figure (cid:1) representation (cid:1) Is the mapping of information to a visual format (cid:1) data objects, their attributes, and the relationships among data objects are translated into graphical elements such as points, lines, shapes, and colors. (cid:1) example: Their attribute values can be represented as the position of the points or the characteristics of the points, e. g. , color, size, and shape. If position is used, then the relationships of points, i. e. , whether they form groups or a point is an outlier, is easily perceived.