PSY 110 Lecture Notes - Lecture 3: Descriptive Statistics

19 Sep 2018
School
Department
Course
Professor
PSY 110 verified notes
3/12View all
Document Summary
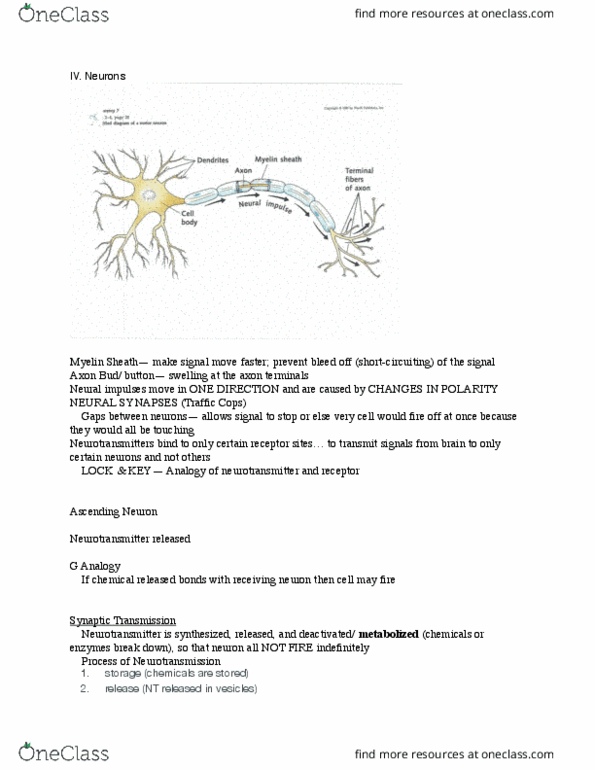
The eld of statistics can be divided into two branches: A. descriptive statistics presenting data in an easy to understand way: measure of central tendency, mean (x*)= sumx/ n easily distorted by outliers dropped to maintain appropriate mean, median, mode. ***deviation= (x- x*: measure of variability, range. S=0 means all data was the same: variance. 1: normal distortion 34%, 14%, 2%, 0. 13% B. inferential statisitcs (far more important to science. Brnach that uses descriptive statistics and probability theory to make judgement or inferences about reality. 5 inferential stats tests= ability to determine if data is signi cant or reliable. 3: repression, chi-square (x^2, reliable results able to be repeated or replicated to obtain similar results. If the variables you are testing show correlation but aren"t correlated, how is it possible that the results were achieved? by chance! Correlation coef cient pearson"s r; ranges from -1 to +1 (neurons intro) Consists of nerves and ganglia outside brain: somatic nervous system.