ECON 1201 Lecture Notes - Lecture 3: Red Tide, Economic Equilibrium, Demand Curve

ECON 1201 verified notes
3/30View all

Document Summary
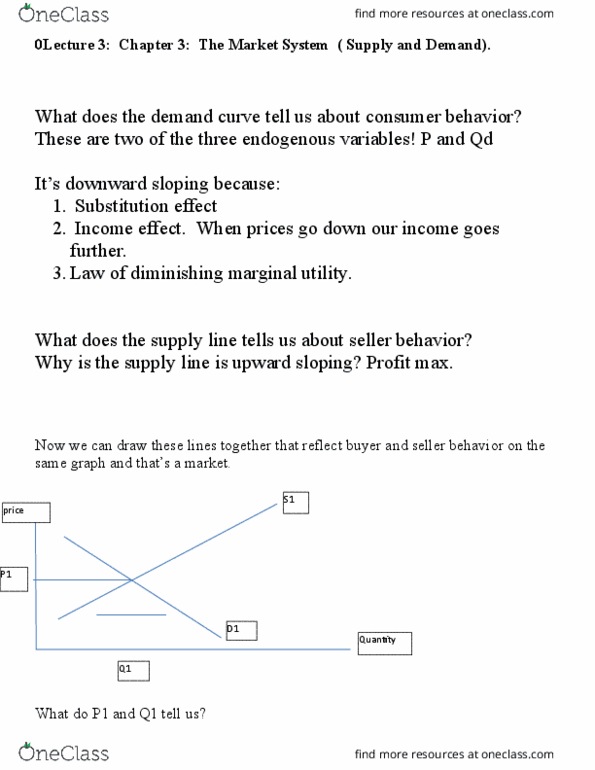
Q1: looking at market for gas, equilibrium price is . 90/gal (ave. price). Suppose in the following months, 10% of all car owners buy electric cars and replace their gasoline cars. Q2: lobster market is /lb, red tide hits east coast(bad for lobster), causes lobster fishermen are only finding one or two instead of a dozen when fishing. What distinction between examples: one affects demand side first and the other affects the supply side first. A competitive market has many buyers and sellers of the same good or service, none of whom can influence the price. The supply and demand model is a model of how a competitive market behaves. A demand curve shows the quantity demanded at various prices. The quantity demanded: the quantity that buyers are willing (and able) to purchase at a particular price. An rightward shift in demand is an increase in demand (and vice versa. )