6
answers
0
watching
1,648
views
8 Feb 2018
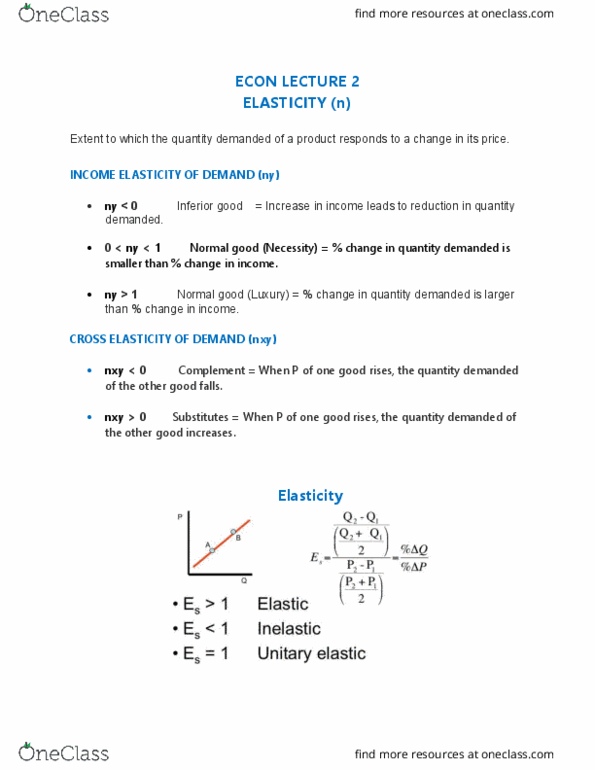
Data collected from the economy of Cardtown reveals that a 16% increase in income leads to the following changes:
⢠A 6% increase in the quantity of chips demanded ⢠A 14% decrease in the quantity of clubs demanded ⢠A 29% increase in the quantity of diamonds demanded
Compute the income elasticity of demand for each good and use the dropdown menus to complete the first column in the following table. Then, based on its income elasticity, indicate whether each good is a normal good or an inferior good. (Hint: Be careful to keep track of the direction of change. The sign of the income elasticity of demand can be positive or negative, and the sign confers important information.)
Good Income Elasticity of Demand Normal or Inferior Good Chips choose one: -2.67, -0.37, 0.38, 2.67 Clubs choose one: -1.14, -0.88, 0.88, 1.14 Diamonds choose one: -1.81, -0.55, 0.55, 1.81
Which of the following three goods is most likely to be classified as a luxury good ?
Chips
Diamonds
Clubs
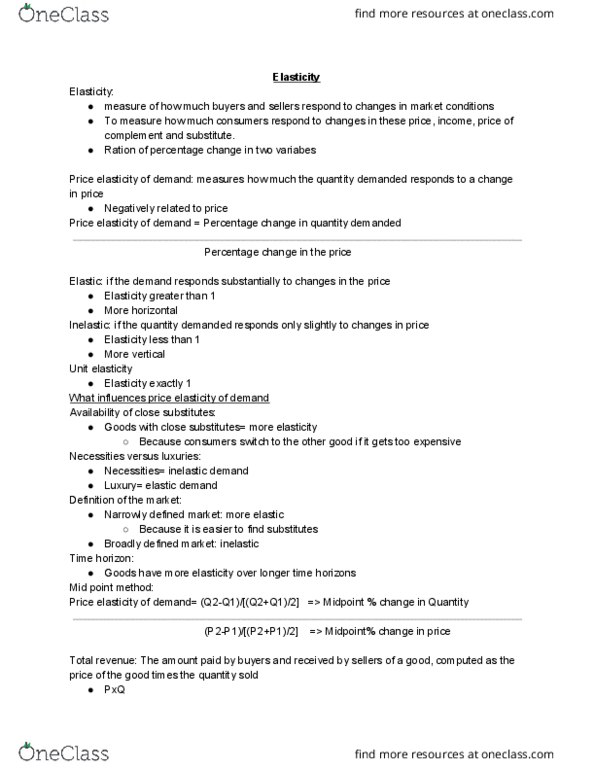
Data collected from the economy of Cardtown reveals that a 16% increase in income leads to the following changes:
| ⢠| A 6% increase in the quantity of chips demanded |
| ⢠| A 14% decrease in the quantity of clubs demanded |
| ⢠| A 29% increase in the quantity of diamonds demanded |
Compute the income elasticity of demand for each good and use the dropdown menus to complete the first column in the following table. Then, based on its income elasticity, indicate whether each good is a normal good or an inferior good. (Hint: Be careful to keep track of the direction of change. The sign of the income elasticity of demand can be positive or negative, and the sign confers important information.)
| Good | Income Elasticity of Demand | Normal or Inferior Good |
|---|---|---|
| Chips | choose one: -2.67, -0.37, 0.38, 2.67 | |
| Clubs | choose one: -1.14, -0.88, 0.88, 1.14 | |
| Diamonds | choose one: -1.81, -0.55, 0.55, 1.81 |
Which of the following three goods is most likely to be classified as a luxury good ?
Chips
Diamonds
Clubs

Read by 2 people

Read by 2 people

Read by 2 people

Read by 2 people

glorysoft2Lv10
2 Oct 2022
Already have an account? Log in

Nelly StrackeLv2
8 Feb 2018
Already have an account? Log in