MGSC 372 Lecture Notes - Lecture 3: Simple Linear Regression, Squared Deviations From The Mean, Regression Analysis

10 May 2017
School
Department
Course
Professor
Document Summary
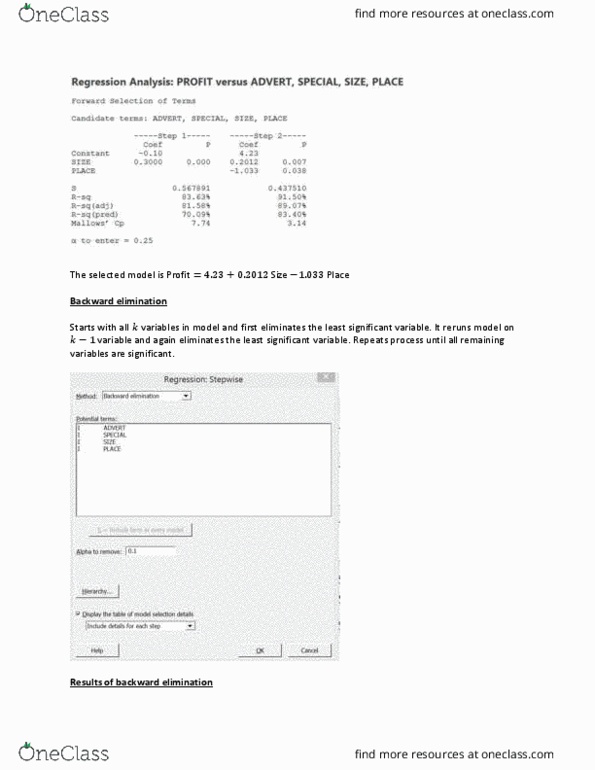
(cid:887). (cid:888)(cid:891) (cid:890). (cid:886)(cid:882) variable. upon theory, knowledge of the subject matter, and the objectives of the analysis. Simple linear regression analysis is used to analyze the nature of the relationship between two variables. The dependent (response) variable is designated by and the independent (predictor) variable is designated by . For a given independent variable, there may be many values of the dependent. The decision regarding which variable to designate and which variable to designate must be based between the two variables is estimated and then used to make predictions for . independent variable and the dependent variable . Observations are plotted in pairs (,) with one variable plotted on each axis. A scatter diagram is a graph showing the shape and direction of the underlying relationship between the. Linear relationships between two variables intercept and slope. The relationship between the two variables is described by a straight line mode in general form: