BIOL 1000 Study Guide - Final Guide: Cabomba, Linear Regression

23 Mar 2020
School
Department
Course
Professor
Document Summary
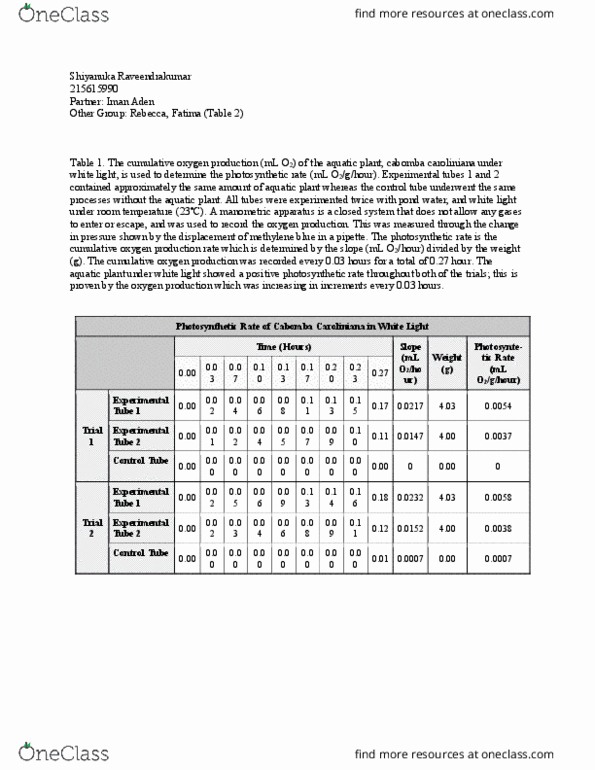
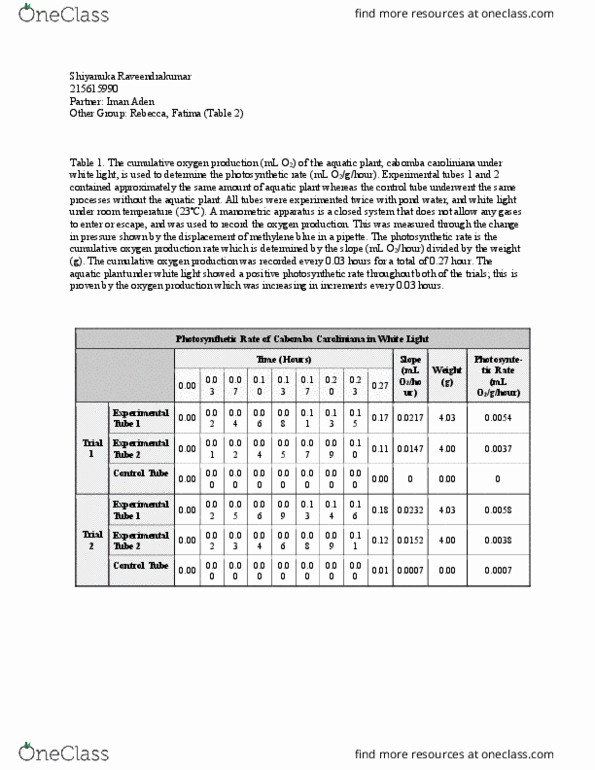
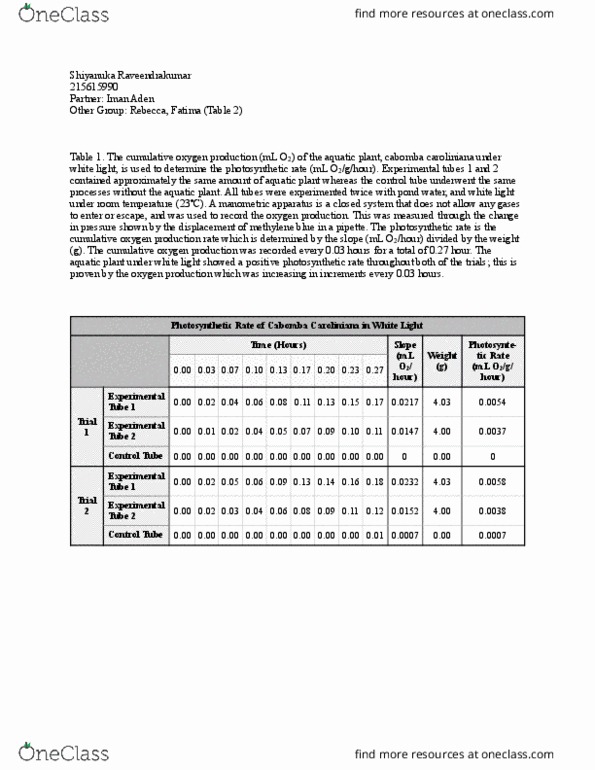
Table 1: cumulative oxygen gas produced by cabomba every 2 minutes (0. 03 hours), under red light in a monometer. Time (hours) exp tube 1 trial 1 exp tube 2 trial 1. Figure 1: cumulative production of o2 gas under red light by 4 tubes containing cabomba, every 2 minutes (0. 03 hours) with 2 control tubes lacking the cabomba. Table 2: cumulative oxygen gas produced by cabomba every 2 minutes (0. 03 hours), under white light in a monometer. Figure 2: cumulative production of o2 gas under white light by 4 tubes containing cabomba, every 2 minutes (0. 03 hours) with 2 control tubes lacking the cabomba. Linear regression line of best fit included for all 6 data groups. Table 3: mean photosynthetic rate (ml o2 produced/g/hour) of cabomba under red light and white light, every 2 minutes (0. 03 hours). 0 r u o h g s e c u d o r p.