STAT 263 Chapter Notes - Chapter 2: Ogive, Upper Class, Old Faithful

25 Apr 2017
School
Department
Course
Professor

Document Summary
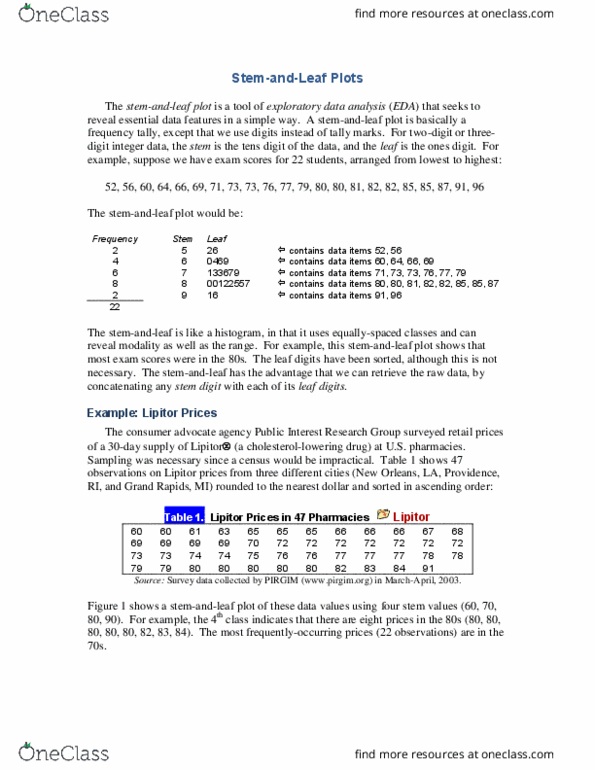
In the last few decades there has been an increased need to process large amounts of data into a usable form. Listing data (a. k. a. organizing) is the first step to any kind of statistical analysis. Some of the ways we can list/order data to make it more readable: by listing in ascending or descending order, dot diagrams (and variations, bar charts (and variations: horizontal/vertical bar charts) Dot diagrams are impractical/ineffective when a data sets contain large amounts of various values and categories. Therefore, we can use a stem-and-leaf display to see a good overall picture of the data without loosing any information. We can form a stem-and-leaf display by referring to the first digit of each number as stem and the digit(s) following as being the leaf. Stem-and-leaf displays are a hybrid kind of arrangement, obtained partly through groupig and partly through listing data. A variation of this display is the double-stem display.