PLG 310 Chapter Notes - Chapter 3: Scatter Plot, Lincoln Near-Earth Asteroid Research, Confounding

Document Summary
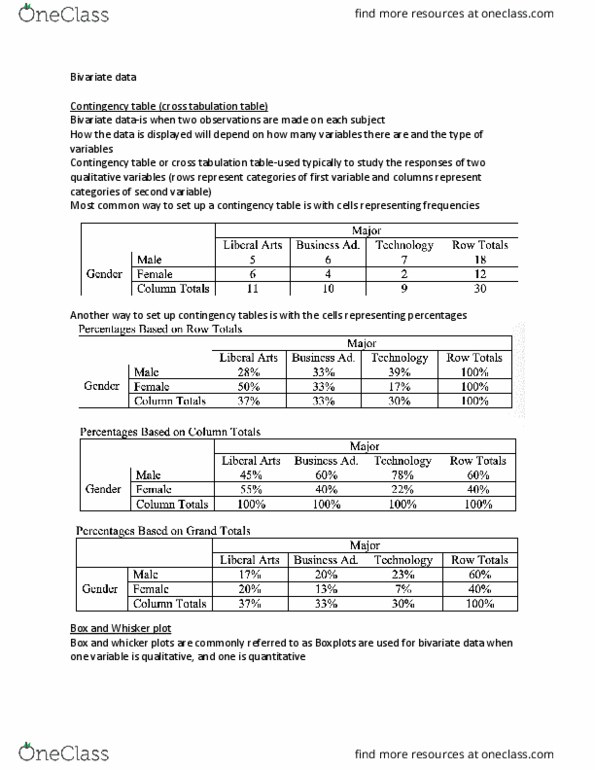
Chapter 3 descriptive analysis and presentation of bivariate data. Not all sample data can be graphically displayed with one variable to graphically display and numerically describe sample data that involves 2 paired variables: we need to use bivariate data. Bivariate data: the values of 2 different variables that are obtained from the same population element. 3 different combinations of variable types that can form bivariate data: One variable is qualitative (attribute) and the other is quantitative (numerical) In this case, the data is arranged in a cross-tabulation or cross-contingency table. Cross-tabulation/ contingency: often show percentages (relative frequencies). They can be based on the entire sample or on the subsample (row or column classifications: example: information on gender and college major. 30 students from a college were randomly identified according to 2 variables (m/f) and major (liberal arts, business administration, technology) These bivariate data can be summarized on a 2 x 3 cross-tabulation table.