PSYB07H3 Chapter Notes - Chapter 2: Interquartile Range, Exploratory Data Analysis, Frequency Distribution

Document Summary
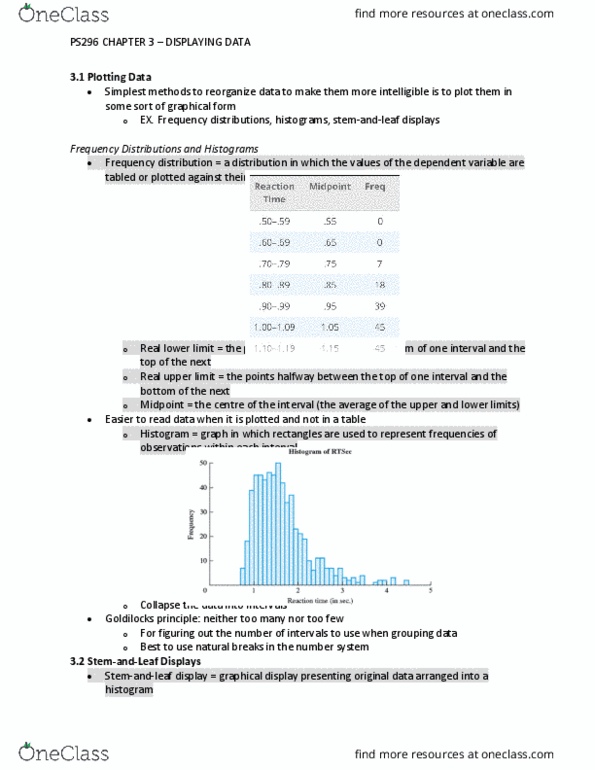
One of the simplest methods to reorganize data to make them more intelligible is to polot them in some sort of graphical form: frequency distributions, histograms, stem-and-leaf displays. Frequency distribution: as a way of organizing them in some sort of logical order. Histogram: graph in which rectangles are used to represent frequencies of observations within each interval. Goal to obscure some of the random noise that is not likely to be meaningful, but still preserves important trends in the data. Real lower limit: the points halfway between the top of one interval and the bottom of the next: the smallest value that would be classed as falling into the interval. Real upper limit: the points halfway between the top of one interval and the bottom of the next: the largest value that would be classed as being in the interval.