MSCI 1000 Chapter Notes - Chapter 6: Total Variation, Categorical Variable, Standard Deviation

21 Jun 2018
School
Department
Course
Professor

CHAPTER 6 – Correlation and Linear Regression
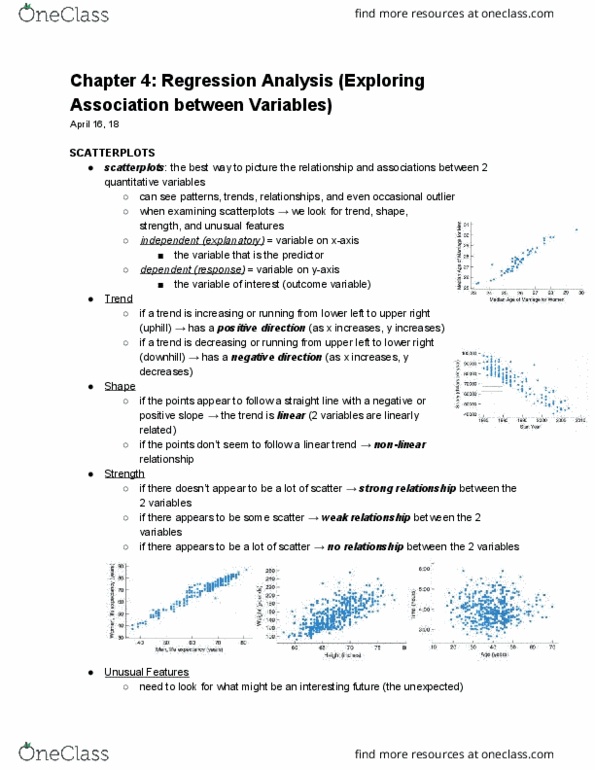
Scatterplots – plots one quantitative variable against another.
- Describe quantitative variables
- Can recognize patterns, trends, relationships or unusual values
- Best way to observe relationship between 2 quantitative variables
- A visual representation of associations
- x-axis and y-axis don’t always meet at zero if data analysed is not near origin
Describing Scatterplots – Associations:
- Direction:
- upper left to lower right ! – negative
- bottom right to upper left " - positive
- Form
o Straight line relationship (linear) – generally consistent, straight form
# Most common and most useful
o Gently curved, but still increasing/decreasing steadily
# Can find ways to straighten it out
o Sharply curved (ex. up then down – need more advanced methods
- Strength – How much scatter?
o Points tightly clustered in single stream
o Points very variable and spread out – can barely discern a trend
- Unusual trends – unusual observation or subgroup
o Outlier – point(s) standing away from overall pattern of the scatterplot
# Needs special attention
# Often need to plot data into subgroups, rather than looing at them all together
X-axis - Explanatory variable (predictor variable), independent variable
Y-axis – response variable, dependent variable
$ “x” explains why “y” happened
Correlation – measures the strength of the linear association between two quantitative variables
- Correlation coefficient – a measure of the strength of the linear relationship between two
quantitative random variables where causations is not assumed
Correlation coefficient: 𝑟=!!!!!
!!!, where 𝑧!=!!!
!!
and 𝑧!=!!!
!!
or 𝑟=(!!!)(!!!!)
(!!!)!(!!!)!=!(!!!)(!!!)
(!!!)!!!!
- Quantitative Variables Condition – correlation only applies to quantitative variables (NOT
categorical)
- Linearity Condition – only summarize/calculate linear relationships, if too curved – the
correlation is misleading
- Outlier condition – report the correlation with and without the outlier point, if there is an
unusual observation
Document Summary
Scatterplots plots one quantitative variable against another. Can recognize patterns, trends, relationships or unusual values. Best way to observe relationship between 2 quantitative variables. X-axis and y-axis don"t always meet at zero if data analysed is not near origin. Upper left to lower right negative. Bottom right to upper left - positive. Form: straight line relationship (linear) generally consistent, straight form. Most common and most useful: gently curved, but still increasing/decreasing steadily. Can find ways to straighten it out: sharply curved (ex. up then down need more advanced methods. Strength how much scatter: points tightly clustered in single stream, points very variable and spread out can barely discern a trend. Unusual trends unusual observation or subgroup: outlier point(s) standing away from overall pattern of the scatterplot. Often need to plot data into subgroups, rather than looing at them all together. Correlation measures the strength of the linear association between two quantitative variables.