ECO 3401 Chapter Notes - Chapter 6.1: Frequency Distribution, Histogram

Document Summary
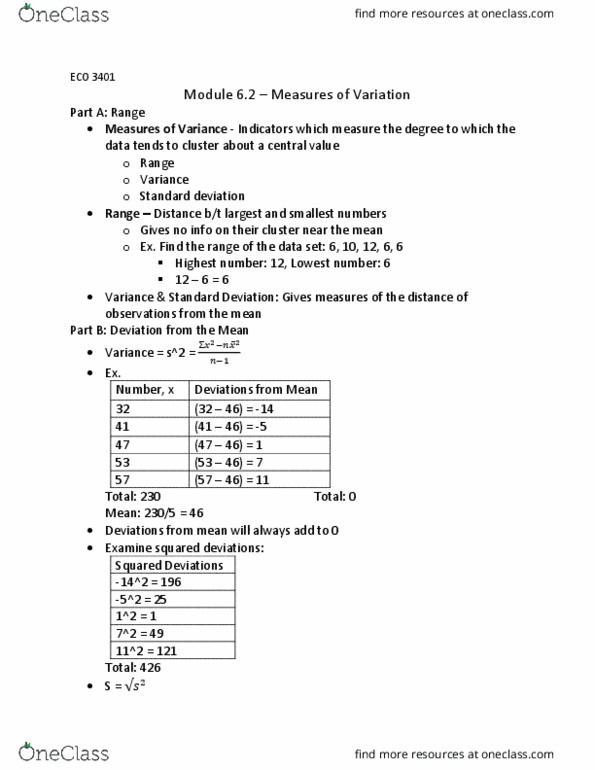
Part b: mean: mean , measures of central tendency: mean, median, mode, ways to calculate mean, add all numbers together and take the average, ex. The (cid:373)ea(cid:374) of the test grades (cid:1012)2,(cid:1011)(cid:1009),(cid:1013)(cid:1010),(cid:1012)(cid:1008) is : (82 + 75 + 96 + 84)/4 , 337/4 , 84. 25, use a frequency table (mean , ex. Quiz scores out of 6 points are summarized in the following. 6 * 4 = 24: mean = 6 + 4 + 40 + 24/15 = 4. 93. Part c: grouped distribution: grouped data scores are combined into categories. The frequency of that category is given: mean = Part d: mean of a grouped distribution example. Part f: median: median middle entry in a set of data arranged in increasing or decreasing. Total/n = 4755/30 = 158. 5 order: ex. 47,59,32,81,74,153: arrange: 32,47,59,74,81,153, divide: (59+74)/2, answer: 66. 5. Part g: measures of central tendency: mode value that occurs most often in a set of numbers, ex.