MATH 1060 Lecture Notes - Lecture 1: Unimodality, Percentile
MATH 1060 verified notes
1/11View all
Document Summary
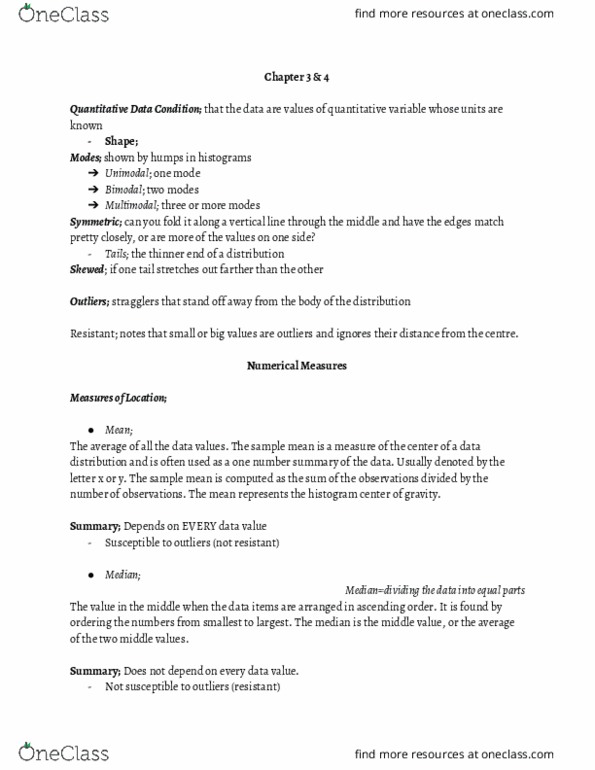
Quantitative data condition; that the data are values of quantitative variable whose units are known. Skewed ; if one tail stretches out farther than the other. Outliers; stragglers that stand off away from the body of the distribution. Resistant; notes that small or big values are outliers and ignores their distance from the centre. The sample mean is a measure of the center of a data distribution and is often used as a one number summary of the data. Usually denoted by the letter x or y. The sample mean is computed as the sum of the observations divided by the number of observations. The mean represents the histogram center of gravity. The value in the middle when the data items are arranged in ascending order. It is found by ordering the numbers from smallest to largest. The median is the middle value, or the average of the two middle values. Summary; does not depend on every data value.


