MATH 1060 Lecture 2: Measures of Variability
MATH 1060 verified notes
2/11View all
Document Summary
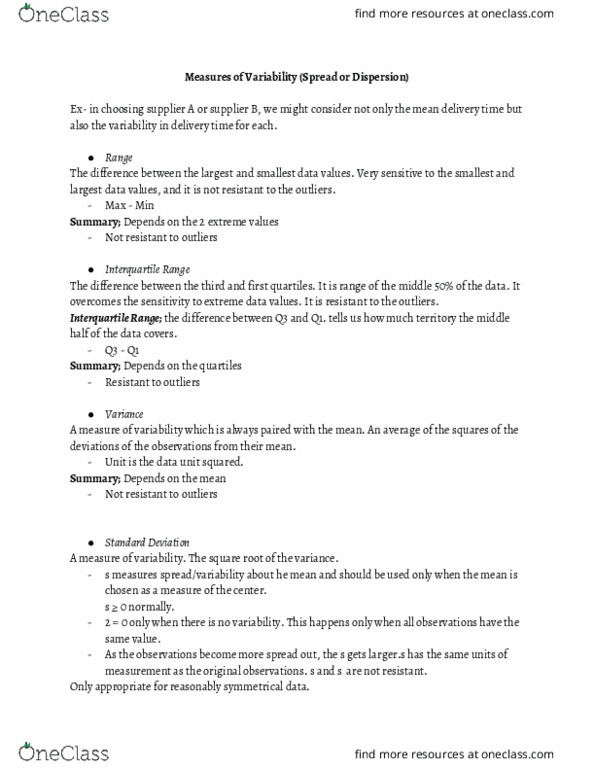
Ex- in choosing supplier a or supplier b, we might consider not only the mean delivery time but also the variability in delivery time for each. The difference between the largest and smallest data values. Very sensitive to the smallest and largest data values, and it is not resistant to the outliers. The difference between the third and first quartiles. It is range of the middle 50% of the data. It overcomes the sensitivity to extreme data values. Interquartile range; the difference between q3 and q1. tells us how much territory the middle half of the data covers. A measure of variability which is always paired with the mean. An average of the squares of the deviations of the observations from their mean. The square root of the variance. s measures spread/variability about he mean and should be used only when the mean is chosen as a measure of the center. s 0 normally.


