SOCSCI 2J03 Lecture 3: Chapter 2 - Graphing and Organization of Data

15 Jan 2019
School
Department
Course
Professor
SOCSCI 2J03 verified notes
3/27View all
Document Summary
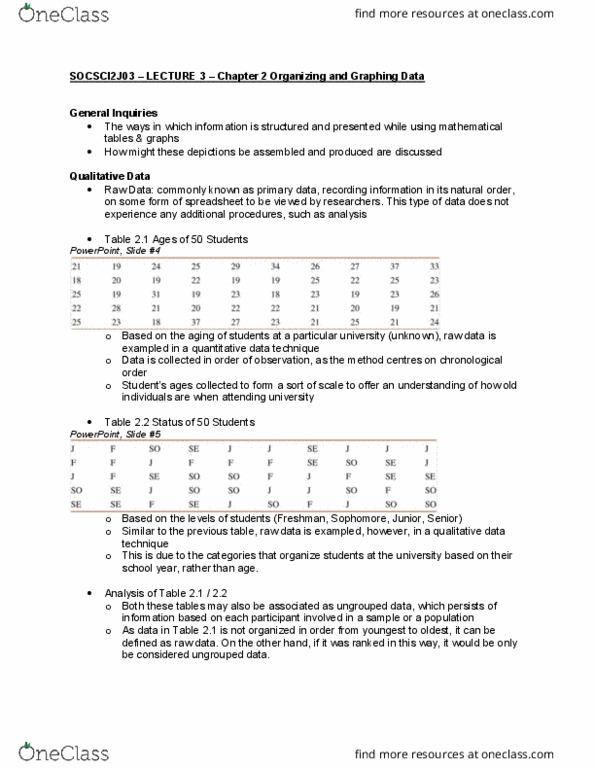
Socsci2j03 lecture 3 chapter 2 organizing and graphing data. General inquiries: the ways in which information is structured and presented while using mathematical tables & graphs, how might these depictions be assembled and produced are discussed. Qualitative data: raw data: commonly known as primary data, recording information in its natural order, on some form of spreadsheet to be viewed by researchers. This type of data does not experience any additional procedures, such as analysis: table 2. 1 ages of 50 students. On the other hand, if it was ranked in this way, it would be only be considered ungrouped data. Powerpoint, slide #11: case study 2-1 ideological composition of the us public 2014. Powerpoint, slide #13: national survey based upon political views of individuals, whom live in america. Individuals were placed into categories based on political beliefs/attitudes, presenting the percentage of the selected population it consisted of, as well as how it has developed or decreased over time.