ITM 696 Lecture Notes - Lecture 8: Data Flow Diagram

18 Apr 2016
School
Department
Course
Professor
Document Summary
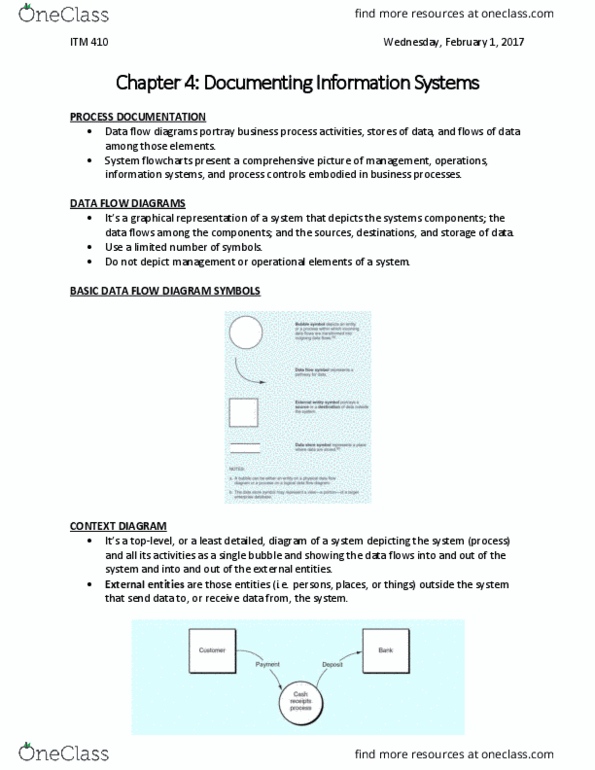
Physical data flow diagram: depicts interactions between entities within the system, nouns (person, place, thing, by whom, where, how, not what activities ie. sales clerk, bookkeeper, cashier. Logical data flow diagram: depicts processes within the system, verbs, activities ie. receive payment, compare stub with payment, record sale. Additional online resources: http://www. getahead-direct. com/gwbadfd. htm (rules) http://www. breezetree. com/article-excel-flowchart-shapes. htm (symbols) http://www. gliffy. com/flowchart-software/ (online flowcharting program) A student based on his or her academic history and a class schedule selects his or her preliminary classes, which are the classes that he or she thinks he or she may take for next quarter. Then, that student carries that information to meet with an advisor who has advisor data and helps the student to make his or her decision on which classes to register. The student after meeting with the advisor and making up his or her own decision will use that final classes data to pre-register for classes.