STAT 101 Lecture 4: stat ch4

13 Jun 2016
School
Department
Course
Professor
Document Summary
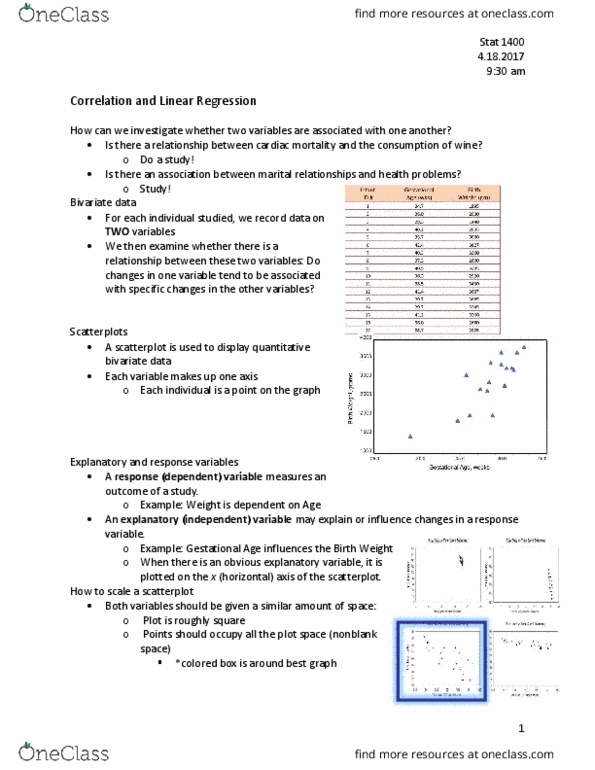
Bivariate data: two measurements (variables) on each individual in a study. We study the relationship between these two variables. Response variable: measure outcome on each individual; denote by y (similar to dependent variable but we won"t use this term) Explanatory variable: may explain or influence changes in the response variable; denote by x (similar to independent variable but we won"t use this term) Sometimes, rv & ev cannot be designated (e. g. which comes first, chicken and egg?) Variables can be: both quantitative, both categorical, or one of each. Study of bivariate data focuses on whether a relationship exists between the explanatory and response variables. A scatterplot shows the relationship between two quantitative variables measured on the same individuals. The values of one variable appear on the horizontal axis, and the values of the other variable appear on the vertical axis.