ECO220Y1 Lecture Notes - Lecture 3: Quartile, Stata, Standard Deviation


27
ECO220Y1 Full Course Notes
Verified Note
27 documents
Document Summary
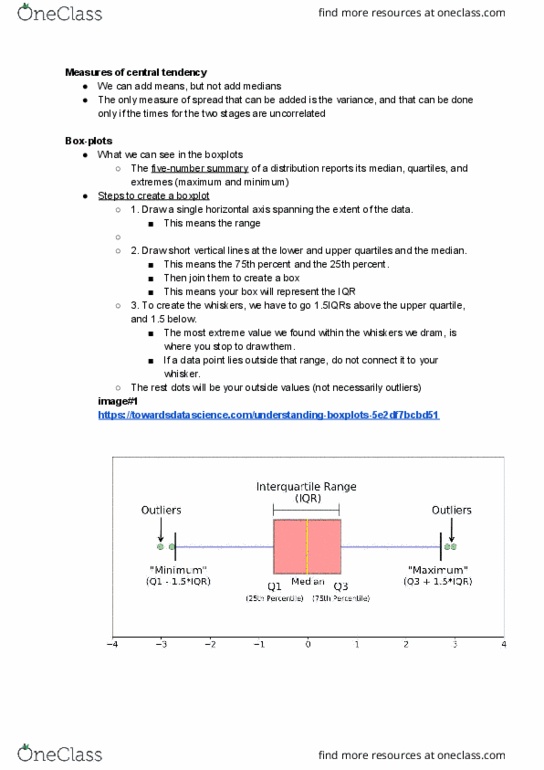
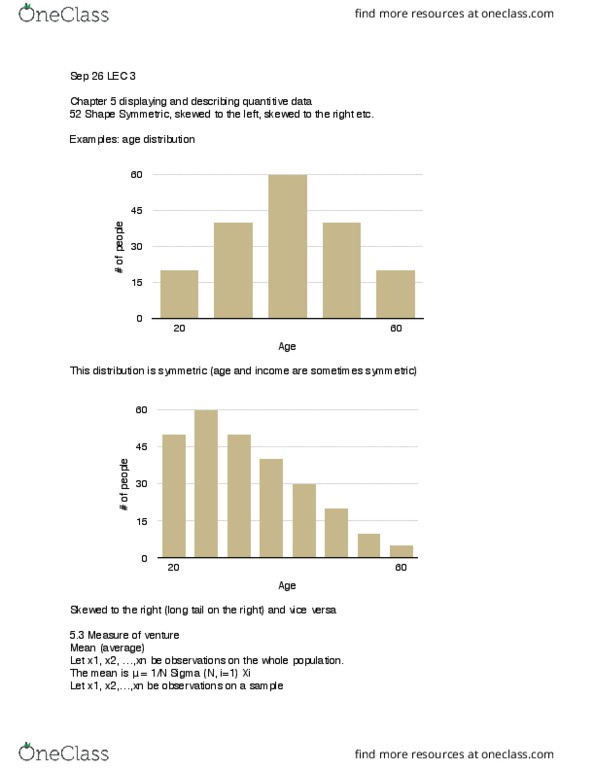
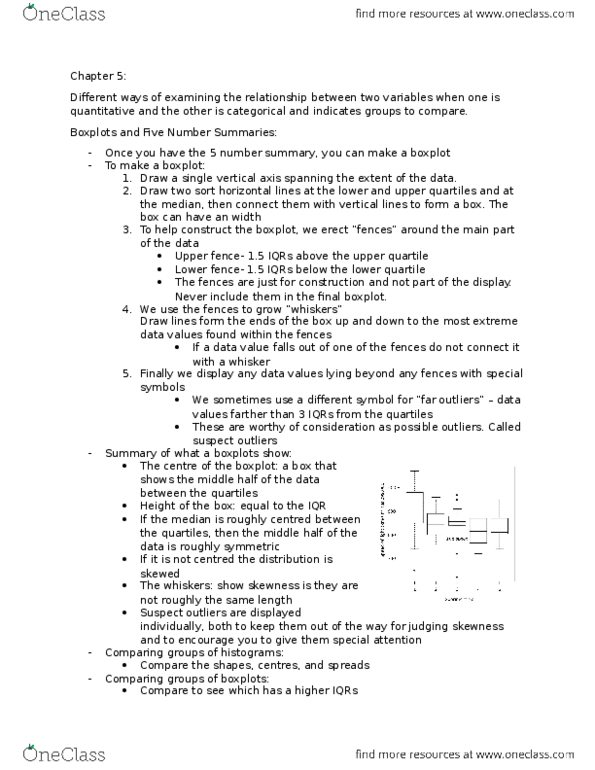
Week 3: percentiles, stata, box plots, standardizing, and other transformations. Multiply midpoint of each group by percentage of sample it represents, then add values for mean. Must estimate a midpoint if highest group has no end limit. Use midpoints, as in regular formula, and multiply by percentage. No need to divide by sample/population size, because working with percentages of sample. Five number summary: reports median, quartiles, maximum, and minimum. Find fences 1. 5 iqrs above upper quartile and below lower quartile. Draw lines from most extreme data values to box, if extreme values fall within fence One symbol for outliers within 3 iqrs and another for far outliers. Useful for comparing variables side by side, but less detailed than histograms. Symmetric, skinny box with long whiskers is normal distribution. Show what percent of data is below the point. Useful to easily divide into quartiles, quintiles, deciles. Useful to compare groups of data with different units.