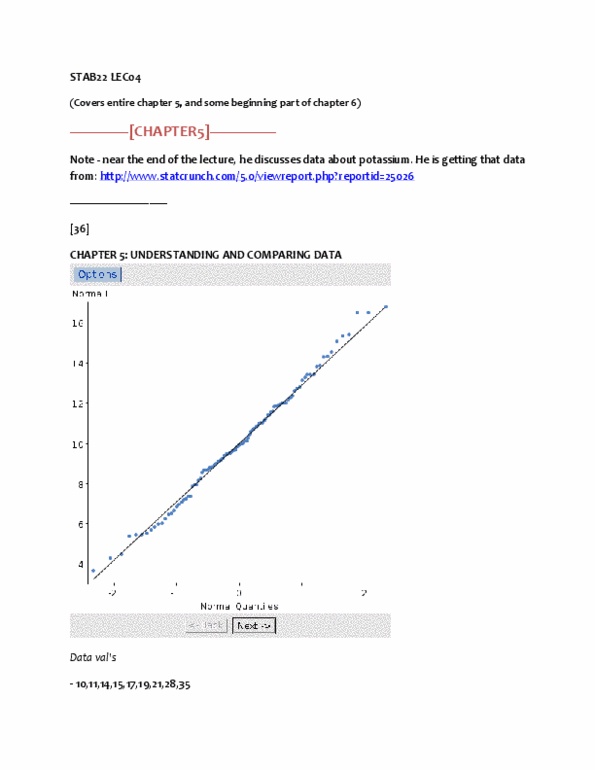
STAB22H3 Chapter 5: Chapter 5 Notes


38
STAB22H3 Full Course Notes
Verified Note
38 documents
Document Summary
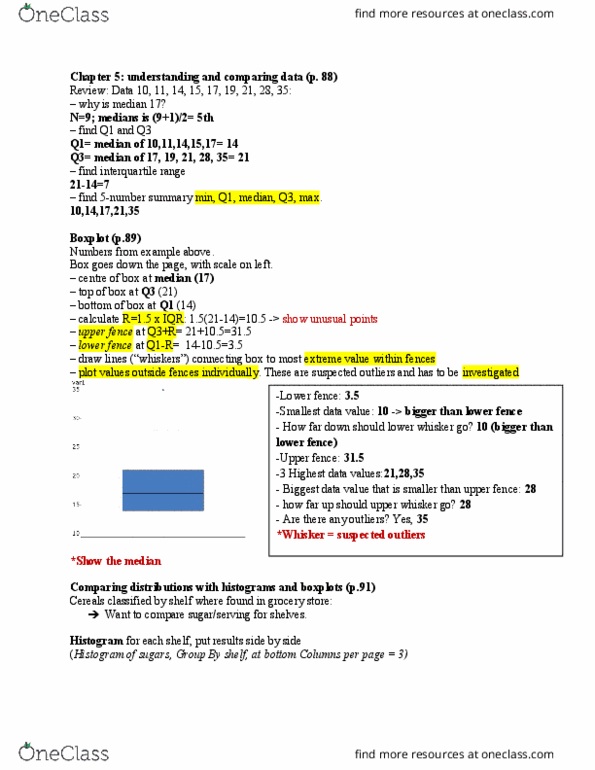
Different ways of examining the relationship between two variables when one is quantitative and the other is categorical and indicates groups to compare. The box can have an width: to help construct the boxplot, we erect fences around the main part of the data. Upper fence- 1. 5 iqrs above the upper quartile. Lower fence- 1. 5 iqrs below the lower quartile. The fences are just for construction and not part of the display. Never include them in the final boxplot: we use the fences to grow whiskers . Draw lines form the ends of the box up and down to the most extreme data values found within the fences. If a data value falls out of one of the fences do not connect it with a whisker: finally we display any data values lying beyond any fences with special symbols. We sometimes use a different symbol for far outliers data values farther than 3 iqrs from the quartiles.