STA130H1 Lecture Notes - Lecture 1: Leland Wilkinson, Histogram, Loess
STA130H1 verified notes
1/13View all
Document Summary
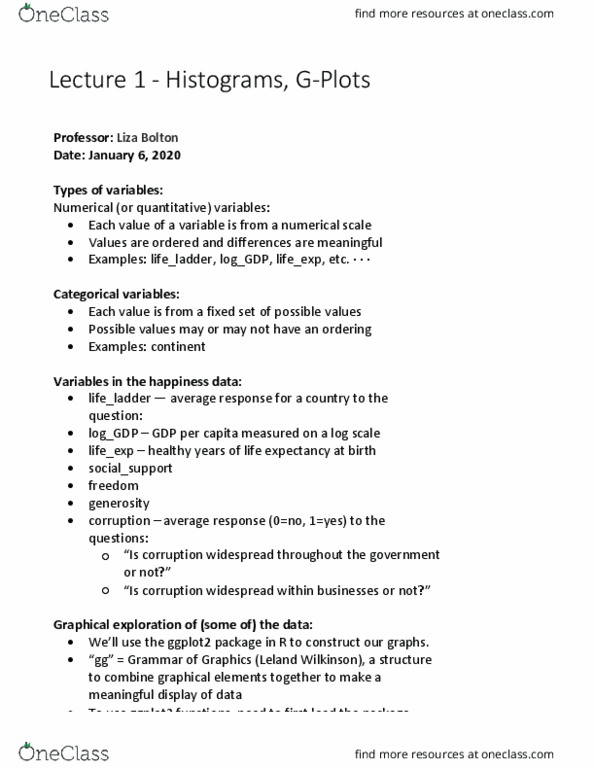
Numerical (or quantitative) variables: each value of a variable is from a numerical scale, values are ordered and differences are meaningful, examples: life_ladder, log_gdp, life_exp, etc. Categorical variables: each value is from a fixed set of possible values, possible values may or may not have an ordering, examples: continent. Is corruption widespread throughout the government or not? . Is corruption widespread within businesses or not? . Some ggplot vocabulary: aesthetic mapping between a variable and where it will be represented on the graph (e. g. , x axis, colour-coding, etc. , geometry what are you plotting (e. g. , points , lines, histogram, etc. ) Every plot must have at least one geometry and there is no upper limit you add a geometry to a plot using + Histogram: plot to show the distribution of a numerical variable. Count the number of numerical values that lie within ranges, called bins.


