STA130H1 Lecture Notes - Lecture 2: Random Variable, Data Wrangling, Linear Combination

STA130H1 verified notes
2/13View all
Document Summary
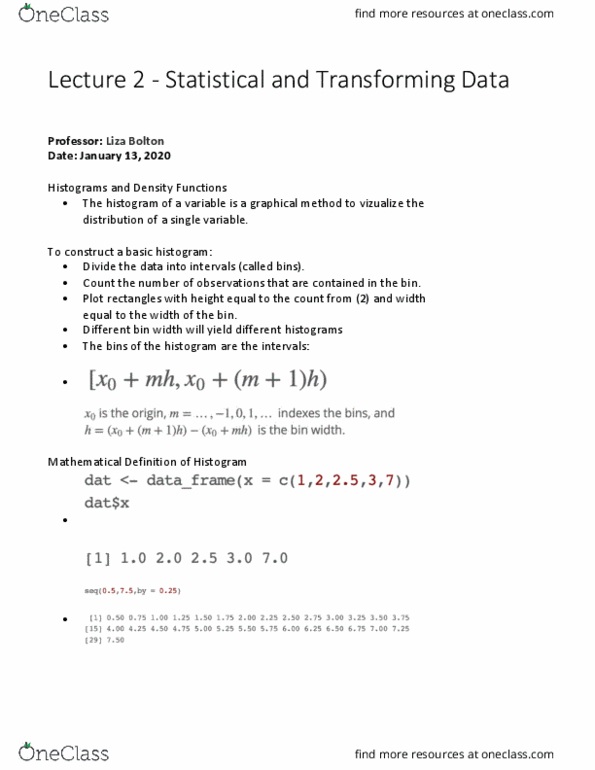
The histogram of a variable is a graphical method to vizualize the distribution of a single variable. To construct a basic histogram: divide the data into intervals (called bins). Count the number of observations that are contained in the bin. Plot rectangles with height equal to the count from (2) and width equal to the width of the bin: different bin width will yield different histograms. The bins of the histogram are the intervals: Statistical data is obtained by observing (random) variables: a random variable can be given a precise mathematical definition that we will cover later in the course. Collecting this data will generate three variables: height, years, and sex. There are three interrelated rules which make a dataset tidy: "for a given dataset, it is usually easy to figure out what are observations and what are variables, but it is surprisingly difficult to precisely define variables and observations in general. " (wickham, 2014)