STA220H1 Lecture Notes - Lecture 2: Categorical Variable, Dependent And Independent Variables, Scatter Plot


STA220H1 verified notes
2/12View all
1
STA220H1 Lecture Notes - Lecture 1: Standard Deviation, Interquartile Range, Frequency Distribution
2
STA220H1 Lecture Notes - Lecture 2: Categorical Variable, Dependent And Independent Variables, Scatter Plot
3
STA220H1 Lecture Notes - Lecture 3: Mutual Exclusivity, Collectively Exhaustive Events, Sample Space
Document Summary
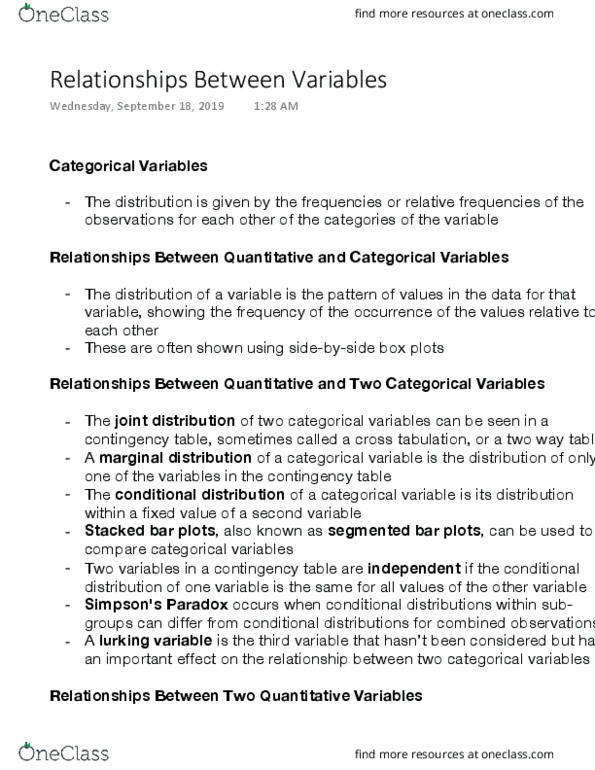
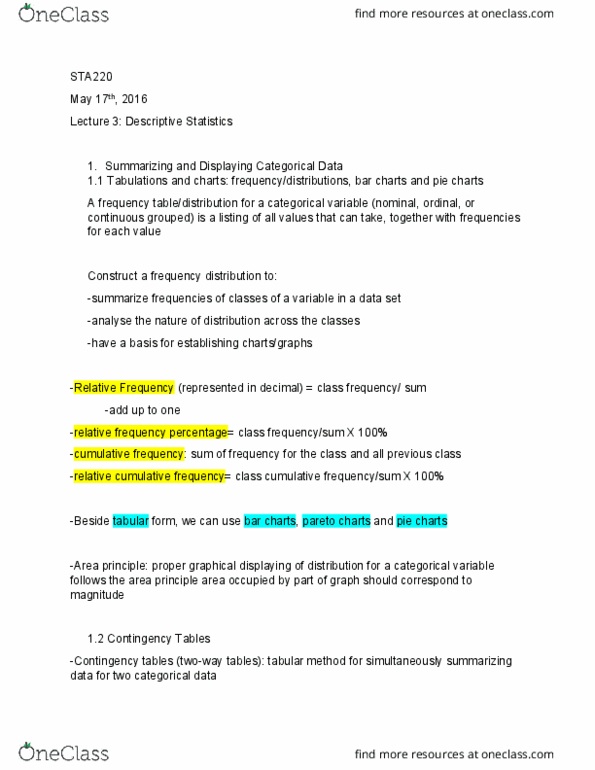
Contingency tables (also known as cross-tabulations or two-way tables) Turns each count in the table into a percentage of individuals who fit a specific value of one of the variables . In a way kind of relative frequency. Simpson"s paradox occurs when there is a tendency for behavior in data of a given variable when divided into groups, but is reversed when groups are combined. This is simply because there is a variable that correlates with both the dependent and independent variables. It is not affected at all by any other variables. When a variable isn"t independent for certain, it"s an explanatory variable. The response variable is the focus of a question in a study or experiment. If you have both a response variable and an explanatory variable, the explanatory variable is always plotted on the x-axis (the horizontal axis). The response variable is always plotted on the y-axis (the vertical axis).