BIOL 1000 Lecture Notes - Lecture 7: Pressure Measurement

25 Feb 2018
School
Department
Course
Professor
Document Summary
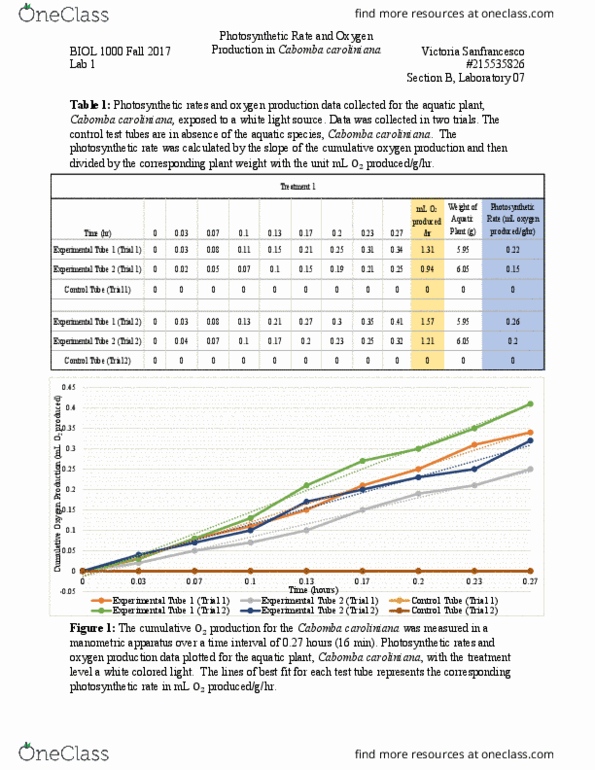
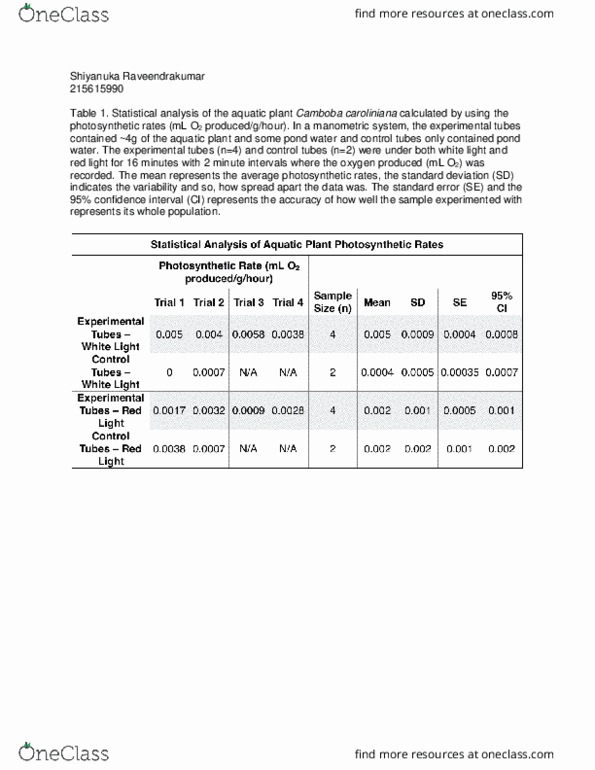
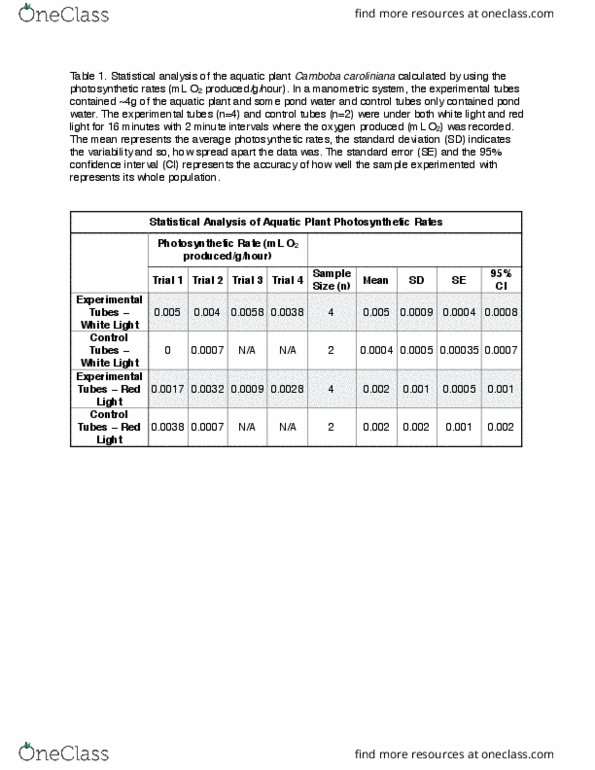
Calculated mean photosynthetic rate, +/-standard error, standard deviation and +/- 95% confidence intervals for the cumulative o2 production of the aquatic plant camboba caroliniana exposed to white and blue light for experimental and control tubes. The lab experiment was preformed in order to measure photosynthetic rate by observing o2 production for the aquatic plant camboba caroliniana using a manometric system under white light. By running four trials in total for both control and experimental tubes the values were compared with another treatment under similar conditions using a different experimental variable of blue light. Compiling both values into a single table and graph allowed the mean, standard deviations, standard errors and +/-95% confidence intervals to be calculated and plotted. This can be confirmed by the error bars showing slight overlap and large error concluding that there is low reliability in the results and white light may not have such an impact.