PHIL 2015 Lecture Notes - Lecture 37: Insulin Resistance, Adipocyte, Metformin

23 May 2020
School
Department
Course
Professor
Document Summary
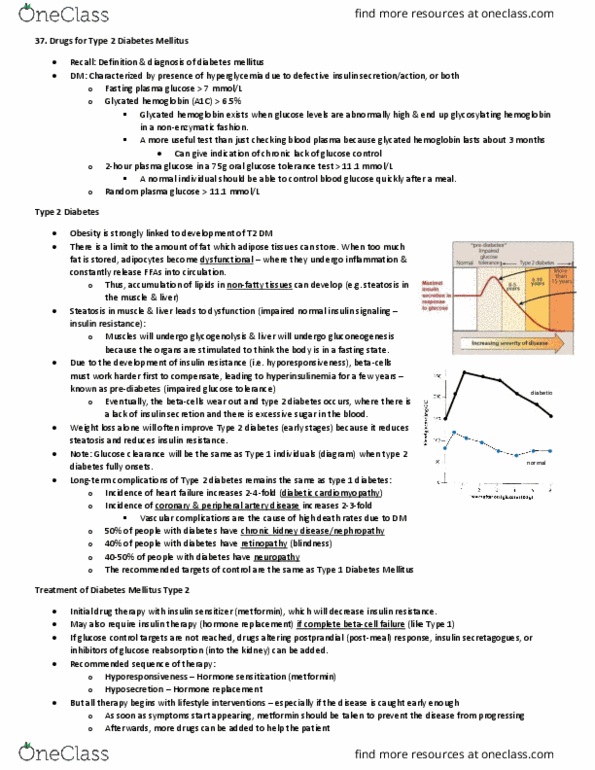
Very useful & informative slide related to relative insufficiency. Y-axis gives the amount of the feature highlighted by the colored lines & x-axis is diff types of dm. Green line, insulin resistance which gets worse over time. As it gets worse, the signalling to the b cells is to make more insulin . So early stages of grey line (insulin production) there is an increased production (so there is no deficiency in terms of absolute count) But it is functioning against ever increasing insulin resistance in the periphery (muscle, adipocyte & liver). Eventually, the adipocytes stop making insulin & begin to atrophy. So now there is a huge difference between insulin resistance & the amount of insulin produced & now see the onset of hyperglycemia (blue line). Long term, b-cell dysfunction leads to outright deficiency of insulin! Diet obesity has a strong interplay with pathogenesis of dm.