STAT 1051 Lecture Notes - Lecture 5: Standard Deviation, Quartile, Percentile

STAT 1051 verified notes
5/30View all
Document Summary
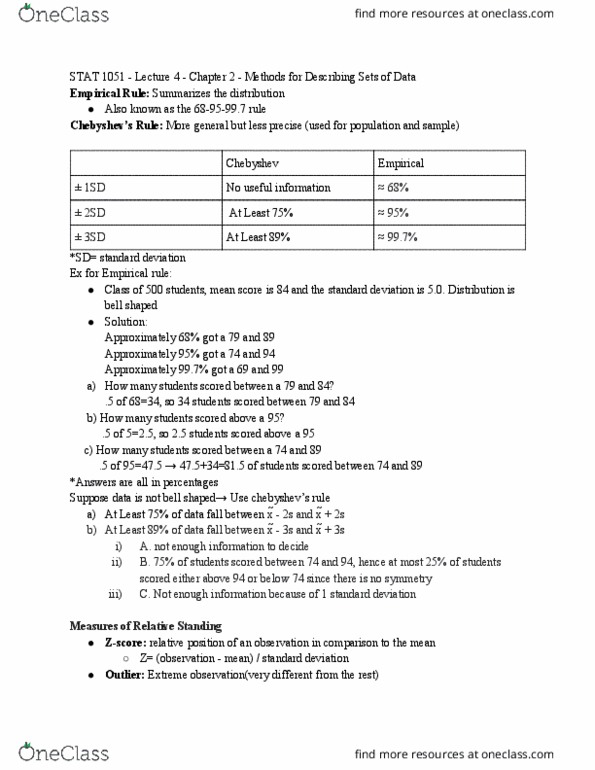
Stat 1051 - lecture 4 - chapter 2 - methods for describing sets of data. More general but less precise (used for population and sample) Class of 500 students, mean score is 84 and the standard deviation is 5. 0. 5 of 5=2. 5, so 2. 5 students scored above a 95 c) how many students scored between a 74 and 89. 5 of 95=47. 5 47. 5+34=81. 5 of students scored between 74 and 89. Z= (observation - mean) / standard deviation. Relative position of an observation in comparison to the mean. Any observation with a z-score bigger than or less than three is considered an. For any p, the pth percentile has a p% of the measures lying below it, and outlier. (100-p)% above it. Someone"s height and weight compared to students of the same age. 3 quartiles which partition the data set into 4 equal arts. Q1(lower quartile) = 25% of the observations are below first quartile.