STAT 1051 Lecture Notes - Lecture 6: Interquartile Range, Standard Score, Box Plot
STAT 1051 verified notes
6/30View all
Document Summary
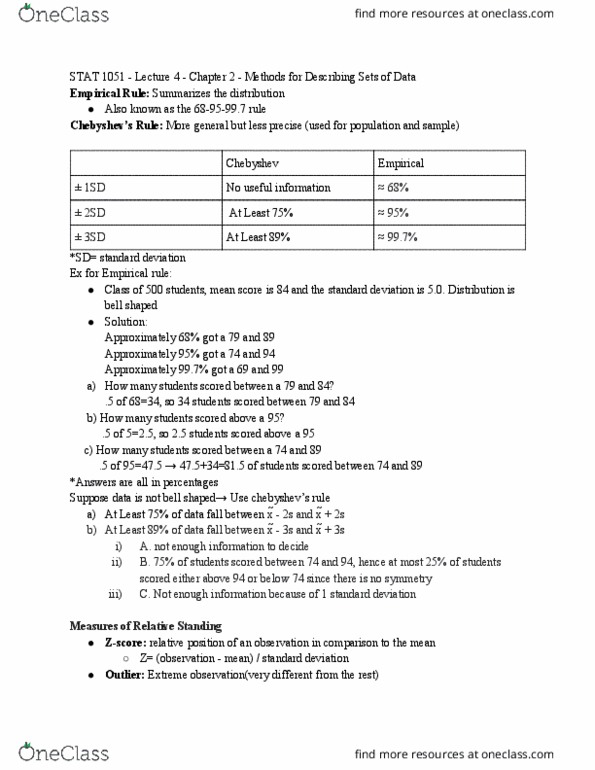
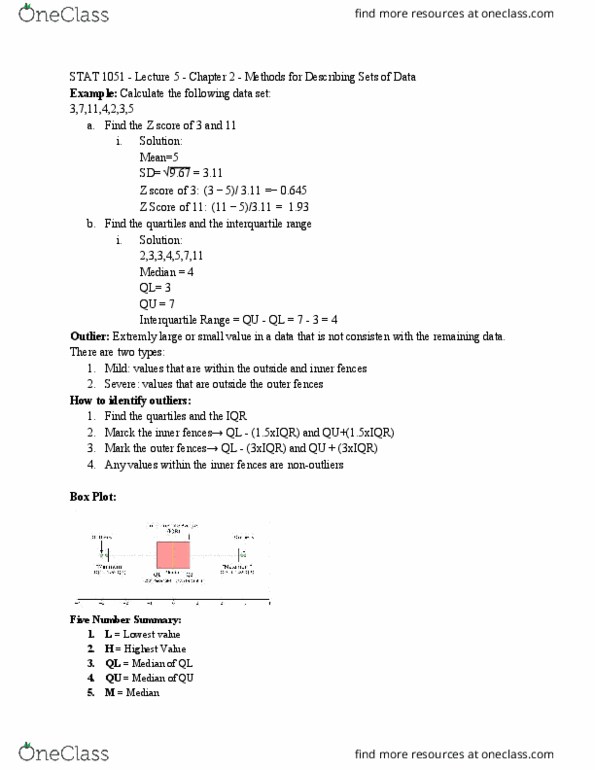
Stat 1051 - lecture 5 - chapter 2 - methods for describing sets of data. Calculate the following data set: find the z score of 3 and 11. Z score of 3: 3 ( 5. 1. 93: find the quartiles and the interquartile range. Interquartile range = qu - ql = 7 - 3 = 4. Extremly large or small value in a data that is not consisten with the remaining data: mild: values that are within the outside and inner fences, severe: values that are outside the outer fences. How to identify outliers: find the quartiles and the iqr, marck the inner fences ql - (1. 5xiqr) and qu+(1. 5xiqr, mark the outer fences ql - (3xiqr) and qu + (3xiqr, any values within the inner fences are non-outliers. Median: l = , h = , ql = , qu = , m = . Stat 1051 - lecture 5 - chapter 2 - methods for describing sets of data cont.


