CHYS 3P15 Final: CHYS 3P15 - Textbook Review for Exam.docx

19 Apr 2012
School
Department
Course
Professor


Document Summary
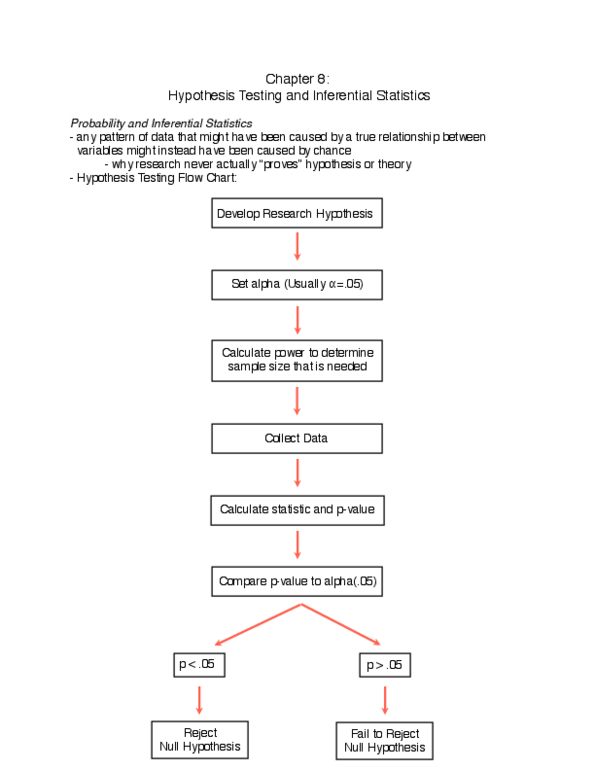
Random error: any pattern of data that might have been caused by a true relationship between variables might instead have been caused by change. Hypothesis testing flow chart: develop research hypothesis, set alpha, calculate power to determine the sample size that is needed, collect data, calculate statistic and p-value, compare p-value to alpha, decide to reject or accept the null. Inferential statistics: use the sample data to draw inferences about the true state of affairs. Sampling distribution: the distribution of all the possible values. Binomial distribution: sample distribution for events have two equally likely possibilities. Null hypothesis: the assumption that the observed data reflect only what would be expected under the sampling distribution. Significance level (alpha): standard that the observed data must meet. The smaller the alpha is, the more stringent the standard is. Probability value (p-value): shows the likelihood of an observed statistic occurring on the basis of the sampling distribution.