COMM 215 Chapter Notes - Chapter 2: Squared Deviations From The Mean, Frequency Distribution, Statistic

7 Apr 2017
School
Department
Course
Professor

Document Summary
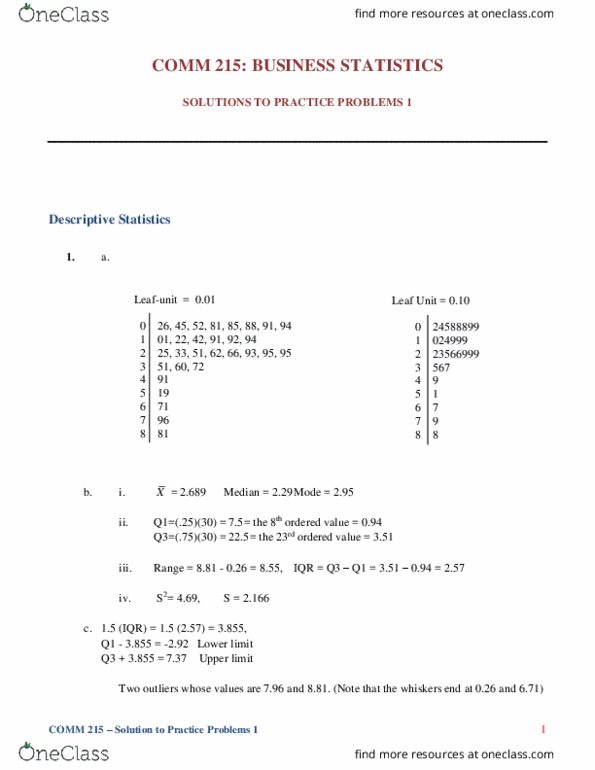
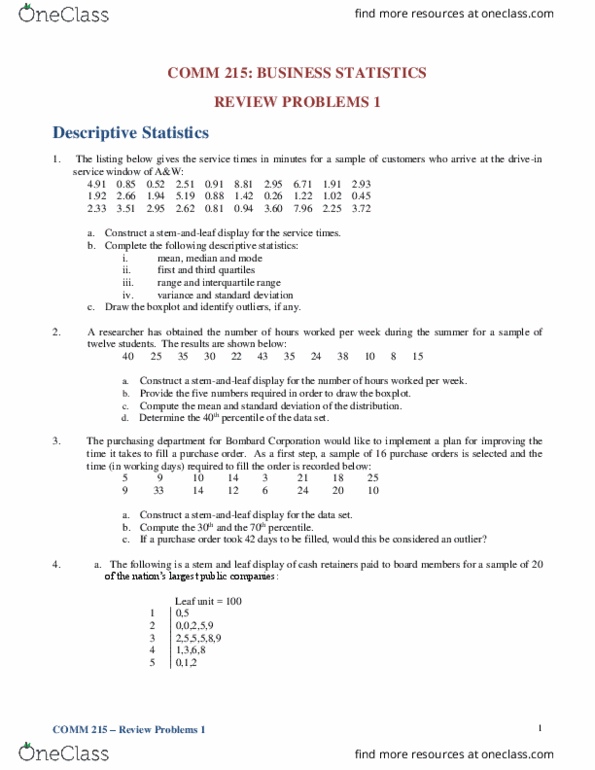
The science of describing the important characteristics of a population or sample. We sample from a population to make inferences about the population. When we display the data collected visually (graph), we can understand the sample & population better. We go back to the (cid:883)(cid:882)(cid:882) randomly selected bank employee"s cell phone usage. 1st column = frequency of observations that make up a line. Last row = the only case where the # of minutes is more than 900. Most # of cases in the 500-599 minute range. 1st row = (cid:883)(cid:883) cases represents all user"s cell times under (cid:883)(cid:882)(cid:882) minutes. 2nd row = (cid:888) cases represent all user"s cell times between (cid:883)(cid:882)(cid:882)-199 minutes. Decide which units will be stems, and which will be leaves. Generally, choose units for the stems that will be between 5-20 stems. Summary of how to set up a stem & leaf display. Put stems in a column from smallest (top) to largest (bottom)