ADM 3318 Chapter Notes - Chapter 11: Relational Capital, Workforce Productivity, Materials Management

10 Mar 2016
School
Department
Course
Professor

Document Summary
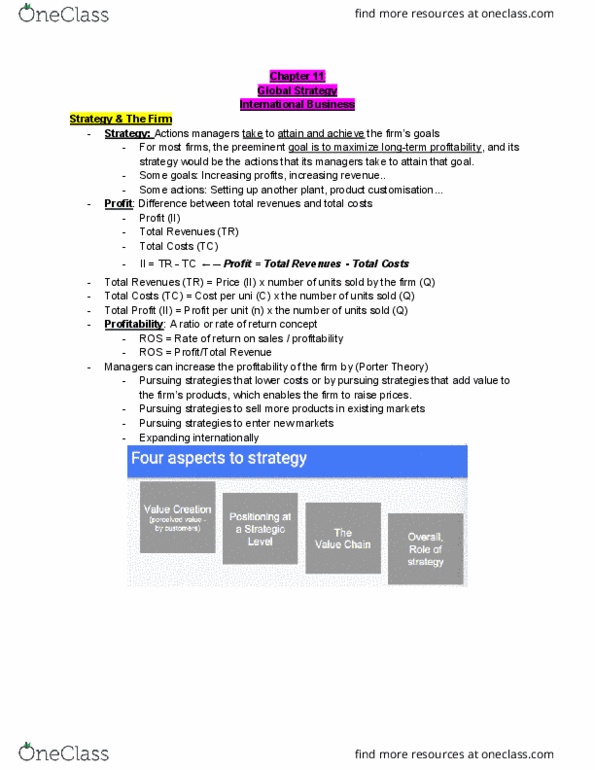
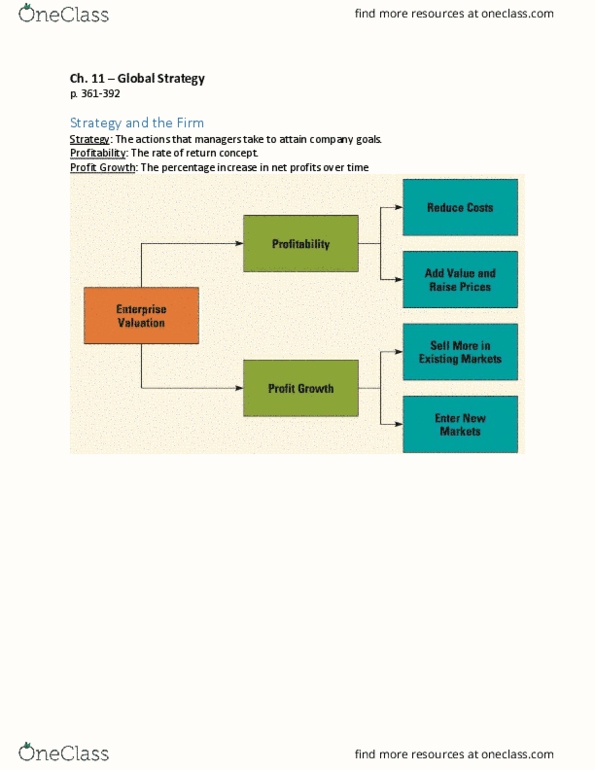
Strategy: acions managers take to atain the irm"s goals. Most irm"s goals is to maximize long-term proitability. Proit: diference between total revenues and total costs: total revenues total costs, total revenues: price x number of units sold, costs: cost per unit imes number of units sold. Proitability: a raio or rate of return concept: proit/total revenues. Managers can increase proitability by pursuing strategies that lower costs or that add value. Two condiions that determine proits: amount of value customers place on the irm"s g/s, firm"s cost of producion. The more value customers place on products, the higher the price can be for those products. Price charged is usually less than the value: consumer surplus. Value creaion: aciviies performed that increase the value of goods or services to customers. Companies can increase customer value by lowering producion costs or by making product more atracive. Firms have high proits when they create more value for their customers at a lower cost.