STAB22H3 Chapter Notes - Chapter 4: Bar Chart, Interquartile Range, Standard Deviation


38
STAB22H3 Full Course Notes
Verified Note
38 documents
Document Summary
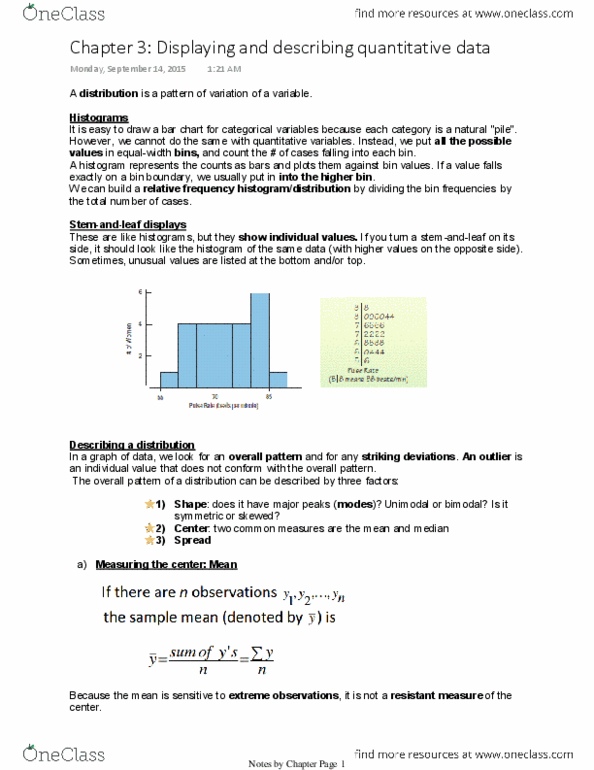
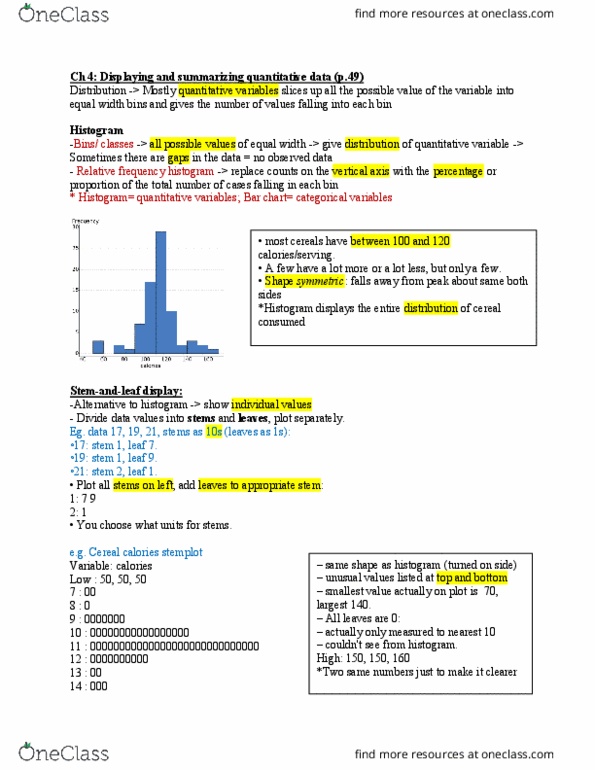
Quantitative variables cannot be put into piles so all possible values are put into equal- width bins, also called classes. Then count the number of cases that fall into each bin. The bins together with these counts, give the distribution of the quantitative variable and provide the building blocks for the histogram. By representing the counts as bars and plotting them against the bin values, the histogram displays the distribution at a glance. Histogram plots the bin counts as the height of the bars. Unlike in bar charts, the bars in histograms do not have spaces between them, and any gaps that are shown are gaps in the data, indicating a region where there are no observed values. Relative frequency histogram: replaces the count on the vertical axis with the percentage or proportion of the total number of cases falling in each bin. Like a histogram, but it shows individual values.