PS296 Chapter Notes - Chapter 3: Goldilocks Principle, Frequency Distribution, Exploratory Data Analysis


Plotting Data
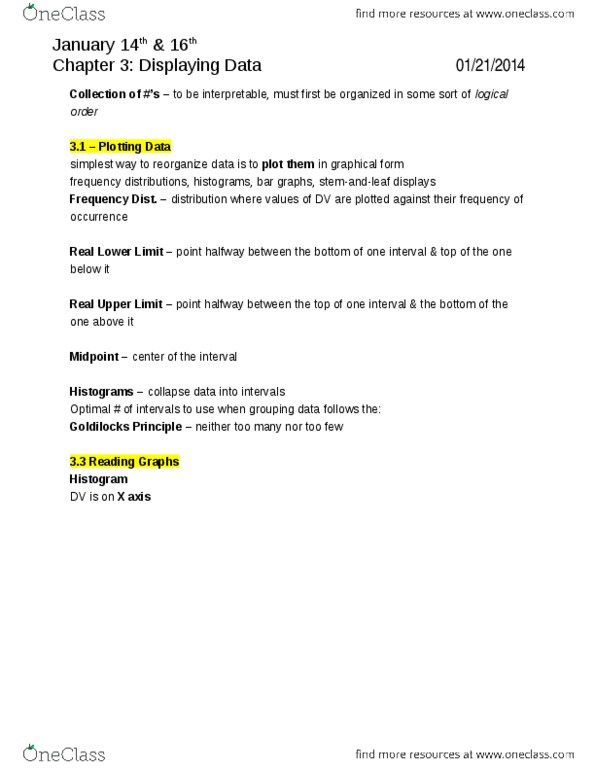
Frequency Distributions and Histograms:
-frequency distribution: organizing data in some sort of logical order
Real lower limit:
-lower bounds for an interval
Real Upper Limit:
-upper bounds for an interval
-any value that falls within these limits is classed as being in the interval
Midpoint:
-the centre of the interval is referred to as the midpoint of the interval
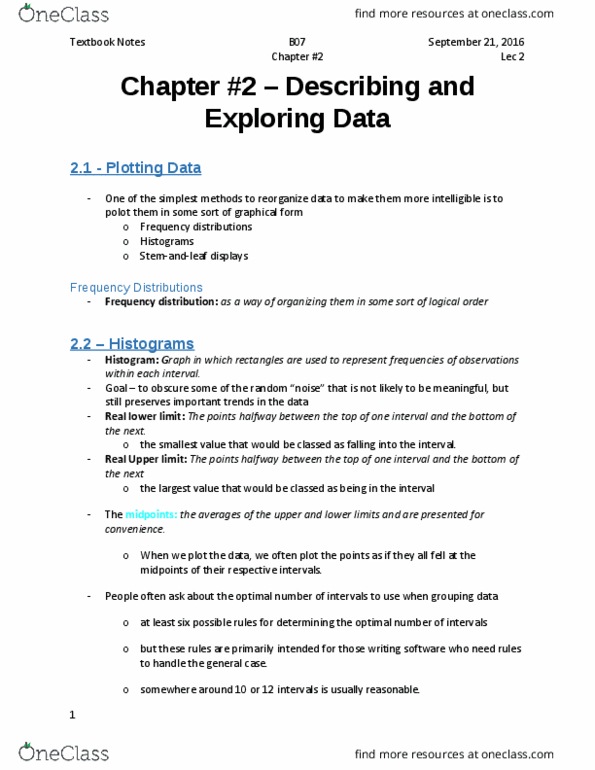
-reaction times seem to tail off to the right as there is a limit on how quickly a participant can
respond but no limit in how long they can take
-histograms generally collapse the data into intervals
Goldilocks principle:
-optimal number of intervals to use when grouping data
-neither too many nor too few
Document Summary
Frequency distribution: organizing data in some sort of logical order. Any value that falls within these limits is classed as being in the interval. The centre of the interval is referred to as the midpoint of the interval. Reaction times seem to tail off to the right as there is a limit on how quickly a participant can respond but no limit in how long they can take. Optimal number of intervals to use when grouping data. Want to illustrate the overall nature of the distribution without excessive detail. It is best to use natural breaks in the number system (ex 0-9, 10-19) As part of his exploratory data analysis approach, developed a variety of methods for displaying data in visually meaningful ways. Leading digits form the stem/vertical axis of display. The units" digits 0, 1, 2, 3, 4 etc are called the trailing (or less significant) digits which form the leaves/horizontal elements of our display.