STAB22H3 Lecture Notes - Lecture 12: Scatter Plot, Microsoft Powerpoint, Dependent And Independent Variables

14 Feb 2019
School
Department
Course
Professor

STAB22H3 verified notes
12/18View all
Document Summary
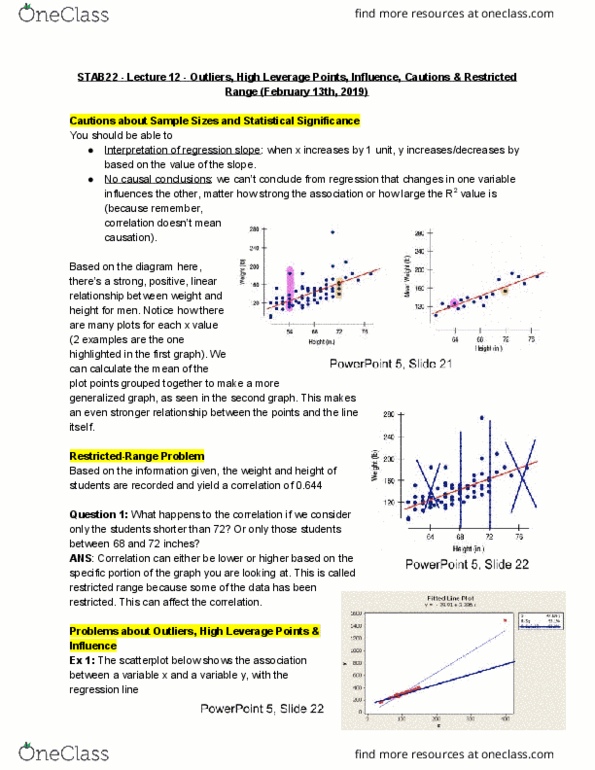
Stab22 - lecture 12 - outliers, high leverage points, influence, cautions & restricted. Interpretation of regression slope : when x increases by 1 unit, y increases/decreases by. Based on the diagram here, there"s a strong, positive, linear relationship between weight and height for men. Notice how there are many plots for each x value (2 examples are the one highlighted in the first graph). We can calculate the mean of the plot points grouped together to make a more generalized graph, as seen in the second graph. This makes an even stronger relationship between the points and the line itself. Based on the information given, the weight and height of students are recorded and yield a correlation of 0. 644. Ans : correlation can either be lower or higher based on the specific portion of the graph you are looking at. This is called restricted range because some of the data has been restricted.