STAB22H3 Chapter Notes - Chapter 5: Box Plot, Equalize


38
STAB22H3 Full Course Notes
Verified Note
38 documents
Document Summary
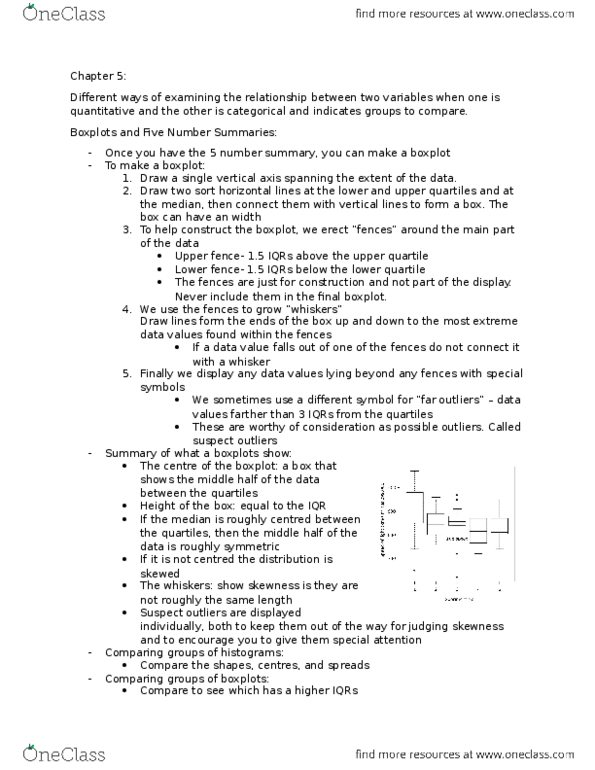
5-number summary can be displayed in a boxplot: vertical axis spanning the extent of the data. Erect fences around the main part of the data to identify outliers, shown with a dotted line place the upper fence 1. 5 iqrs above q3 (q3 + 1. 5iqr) and the lower fence 1. 5. If a data value falls outside the fences, it does not get connect with a whisker (the line from the box connecting the min. and max. values) If the min. or max. value falls outside of the fence, the most extreme value within the fences is also marked (because it is the highest/lowest non-outlier) The height of the box made by the q1, median, and q3 is equal to the iqr. If the median is roughly at the centre of the box, the middle half of the data is roughly symmetric, if it is not centred, the distribution is skewed. The length of the whiskers also indicate distribution symmetry/skewness.